Examples
DDR ships with pre-trained weights and example notebooks for both supported geodatasets.
Directory Structure
examples/
├── merit/                      # MERIT-Hydro examples
│   ├── example_config.yaml     # Config pointing to v0.5.2 trained weights
│   ├── ddr-v0.5.2_merit_trained_weights.pt
│   └── plot_parameter_map.ipynb
├── lynker_hydrofabric/         # Lynker Hydrofabric v2.2 examples
│   ├── example_config.yaml     # Config pointing to v0.5.2 trained weights
│   ├── ddr-v0.5.2.lynker_hydrofabric_trained_weights.pt
│   └── plot_parameter_map.ipynb
├── eval/                       # Evaluation notebook (dataset-agnostic)
│   └── evaluate.ipynb
└── parameter_maps/             # Legacy v0.1.0a2 example (Lynker only)
    └── plot_parameter_map.ipynb
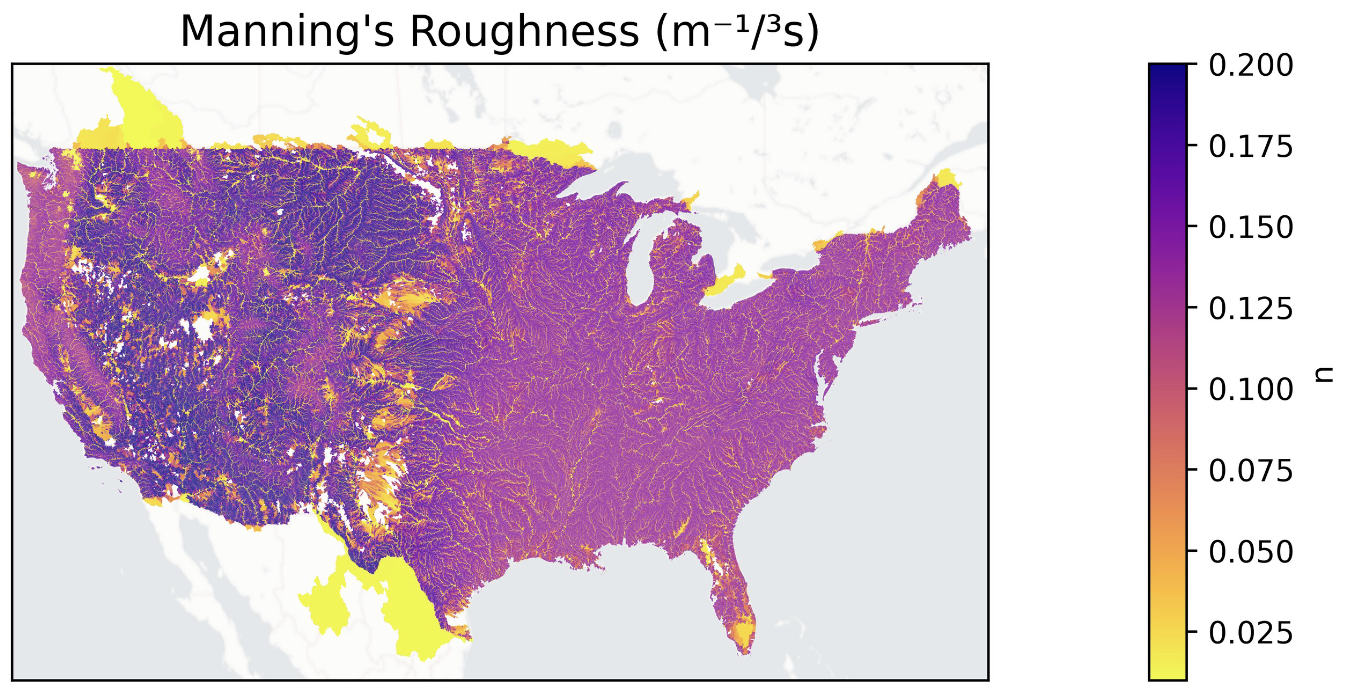
Parameter Map Notebooks
These notebooks visualize the spatial distribution of learned routing parameters (Manning's roughness, channel geometry) across CONUS.
Setup
- Set
DDR_DATA_DIRto your local data directory, or edit theexample_config.yamlpaths directly - Open the notebook for your dataset (
examples/merit/orexamples/lynker_hydrofabric/) - Run all cells
Each example_config.yaml uses ${oc.env:DDR_DATA_DIR,./../../data} so paths resolve relative to the repo root's data/ folder by default.
What the Notebooks Show
- Load config and trained weights — The v0.5.2 checkpoints use a 10-attribute KAN with
hidden_size=21,grid=50,k=2 - Predict spatial parameters — Run the KAN in eval mode to produce per-catchment parameter predictions
- Map parameters — Plot Manning's n, q_spatial, and other learned parameters on the CONUS river network using GeoPandas and contextily basemaps
MERIT vs Lynker Differences
| Aspect | MERIT | Lynker Hydrofabric |
|---|---|---|
| Geodataset enum | merit |
lynker_hydrofabric |
| ID column | COMID (integer) |
divide_id (string, cat-* prefix) |
| Geometry file | .shp |
.gpkg (layer: divides) |
| Upstream area attribute | log10_uparea |
log_uparea |
Model Evaluation
The examples/eval/evaluate.ipynb notebook demonstrates how to compare routed predictions against observations and the summed Q' baseline.