Hurricane Isaias streamflow forecast: a qualitative retrospective
Before Hurricane Isaias reached the Gulf Coast, we published 18-hour streamflow forecasts for 12 Alabama watersheds. This follow-up compares those forecasts with the USGS observations that followed. Because we have the completed graphics but not the underlying time series here, this is deliberately a visual, qualitative assessment rather than a calculation of forecast skill.
Isaias made landfall near Destin, Florida, as a Category 2 hurricane at 01:30 UTC on October 10, crossed southern Alabama, and became post-tropical that morning. After unusually strong seasonal wind shear briefly relaxed, Isaias intensified from Category 1 to Category 3 overnight before weakening ahead of landfall, as Scientific American reported. The rapid intensification made Isaias a powerful storm, but its track and the placement of its rain, not its category alone, determined which watersheds responded.
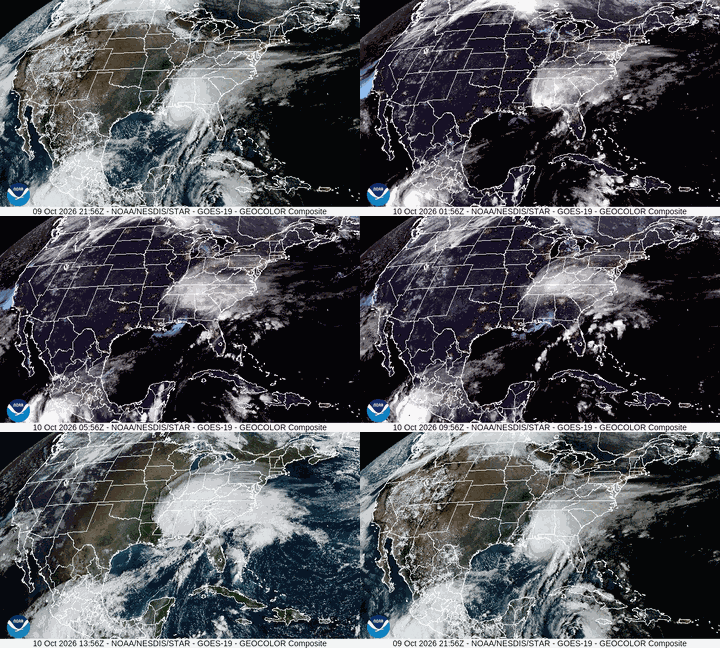
GOES-19 GeoColor imagery from NOAA/NESDIS/STAR shows Isaias approaching the northern Gulf Coast and moving inland. The web version is reduced in resolution and frame rate.
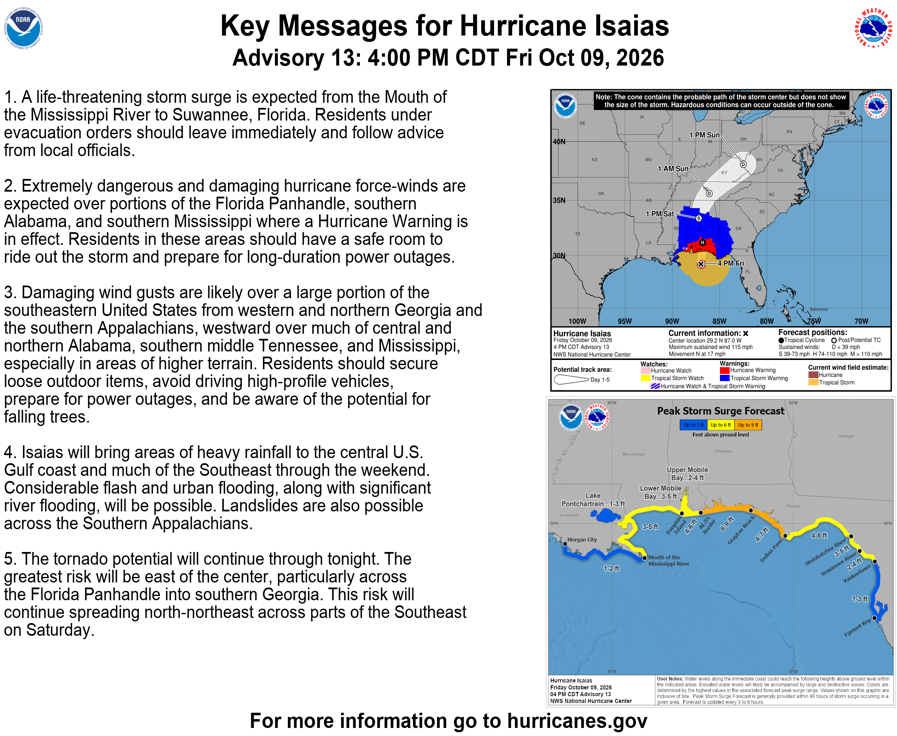
The National Hurricane Center forecast available when the original post was published: Advisory 13, October 9, 2026, 4:00 p.m. CDT.
Precipitation Map
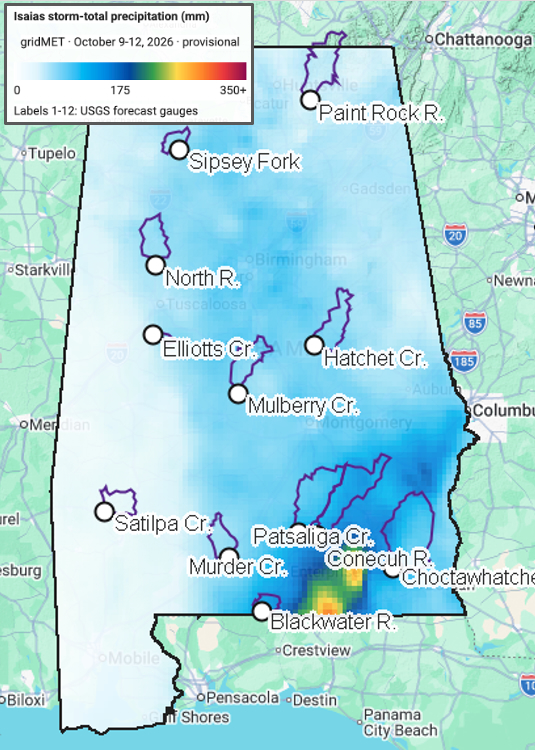
Provisional gridMET storm-total precipitation for October 9-12, with the forecast gauges and CAMELS basin boundaries. The heaviest rain was confined to far southeastern Alabama and fell mostly between the Blackwater, Murder Creek, Patsaliga Creek, Conecuh, and Choctawhatchee basins. Western Alabama received only light rainfall.
This precipitation pattern explains much of the overforecasting. Isaias veered east of the forecast track, so the broad rainfall footprint implied by the forecast hydrographs did not materialize over the western and northern basins. Data assimilation (DA) can improve the model's initial hydrologic state, but it cannot correct a future storm-track or precipitation-placement error. The false alarms at Sipsey Fork, North River, Satilpa Creek, and Paint Rock are consistent with that mismatch.
Even in the southeast, the rainfall maximum largely missed the monitored watershed polygons, helping explain why neighboring basins produced very different responses. The closest forecasts remained in the south-central cluster, while Hatchet Creek was the clearest underforecast and the open loop was closer than DA at the Choctawhatchee peak. Overall, DA did not consistently outperform the open loop during this event.
Gauge-by-gauge validation
Colored lines are successive DA forecasts, orange lines are open-loop forecasts, and black dots are USGS observations. Times are UTC and discharge is in cubic meters per second (m³/s).
1. Choctawhatchee River near Newton
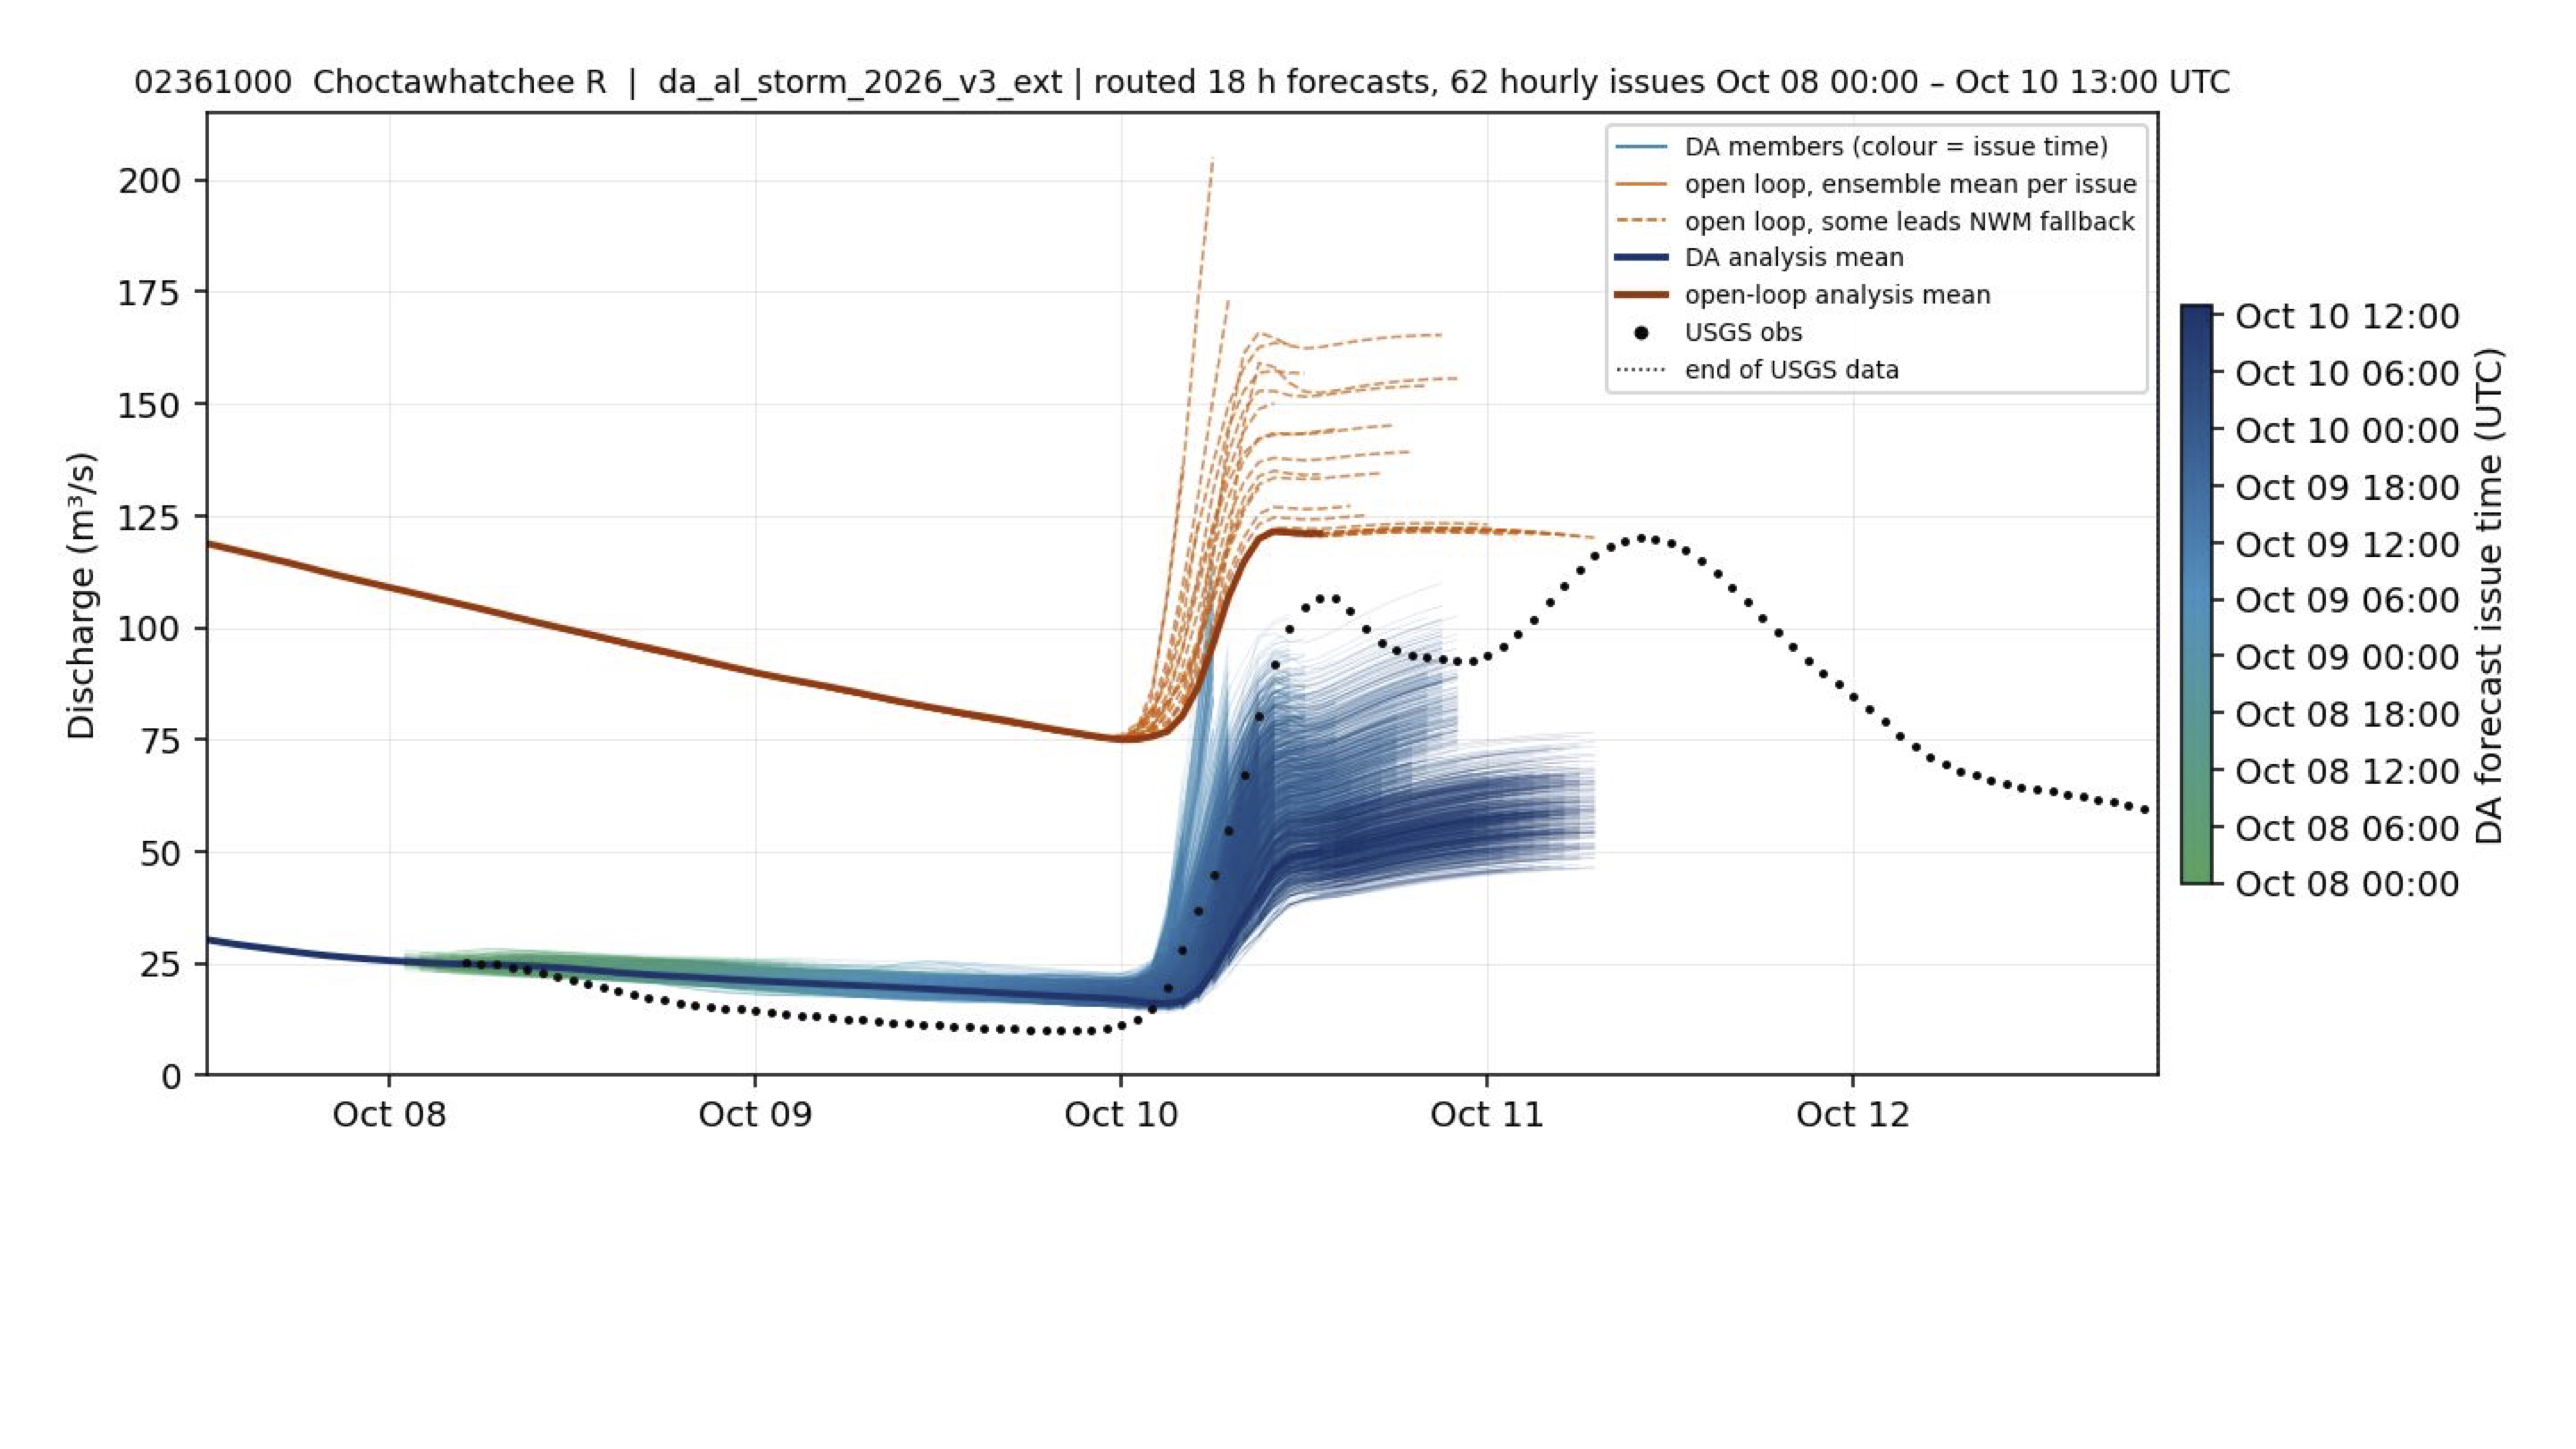
Despite Isaias's Category 2 landfall, the precipitation map shows that storm intensity did not translate into uniform rainfall over the forecast watersheds. The Choctawhatchee produced one of the larger responses, peaking near 125 m³/s; the DA ensemble remained too low, while the open loop came closer to the peak.
2. Blackwater River near Bradley
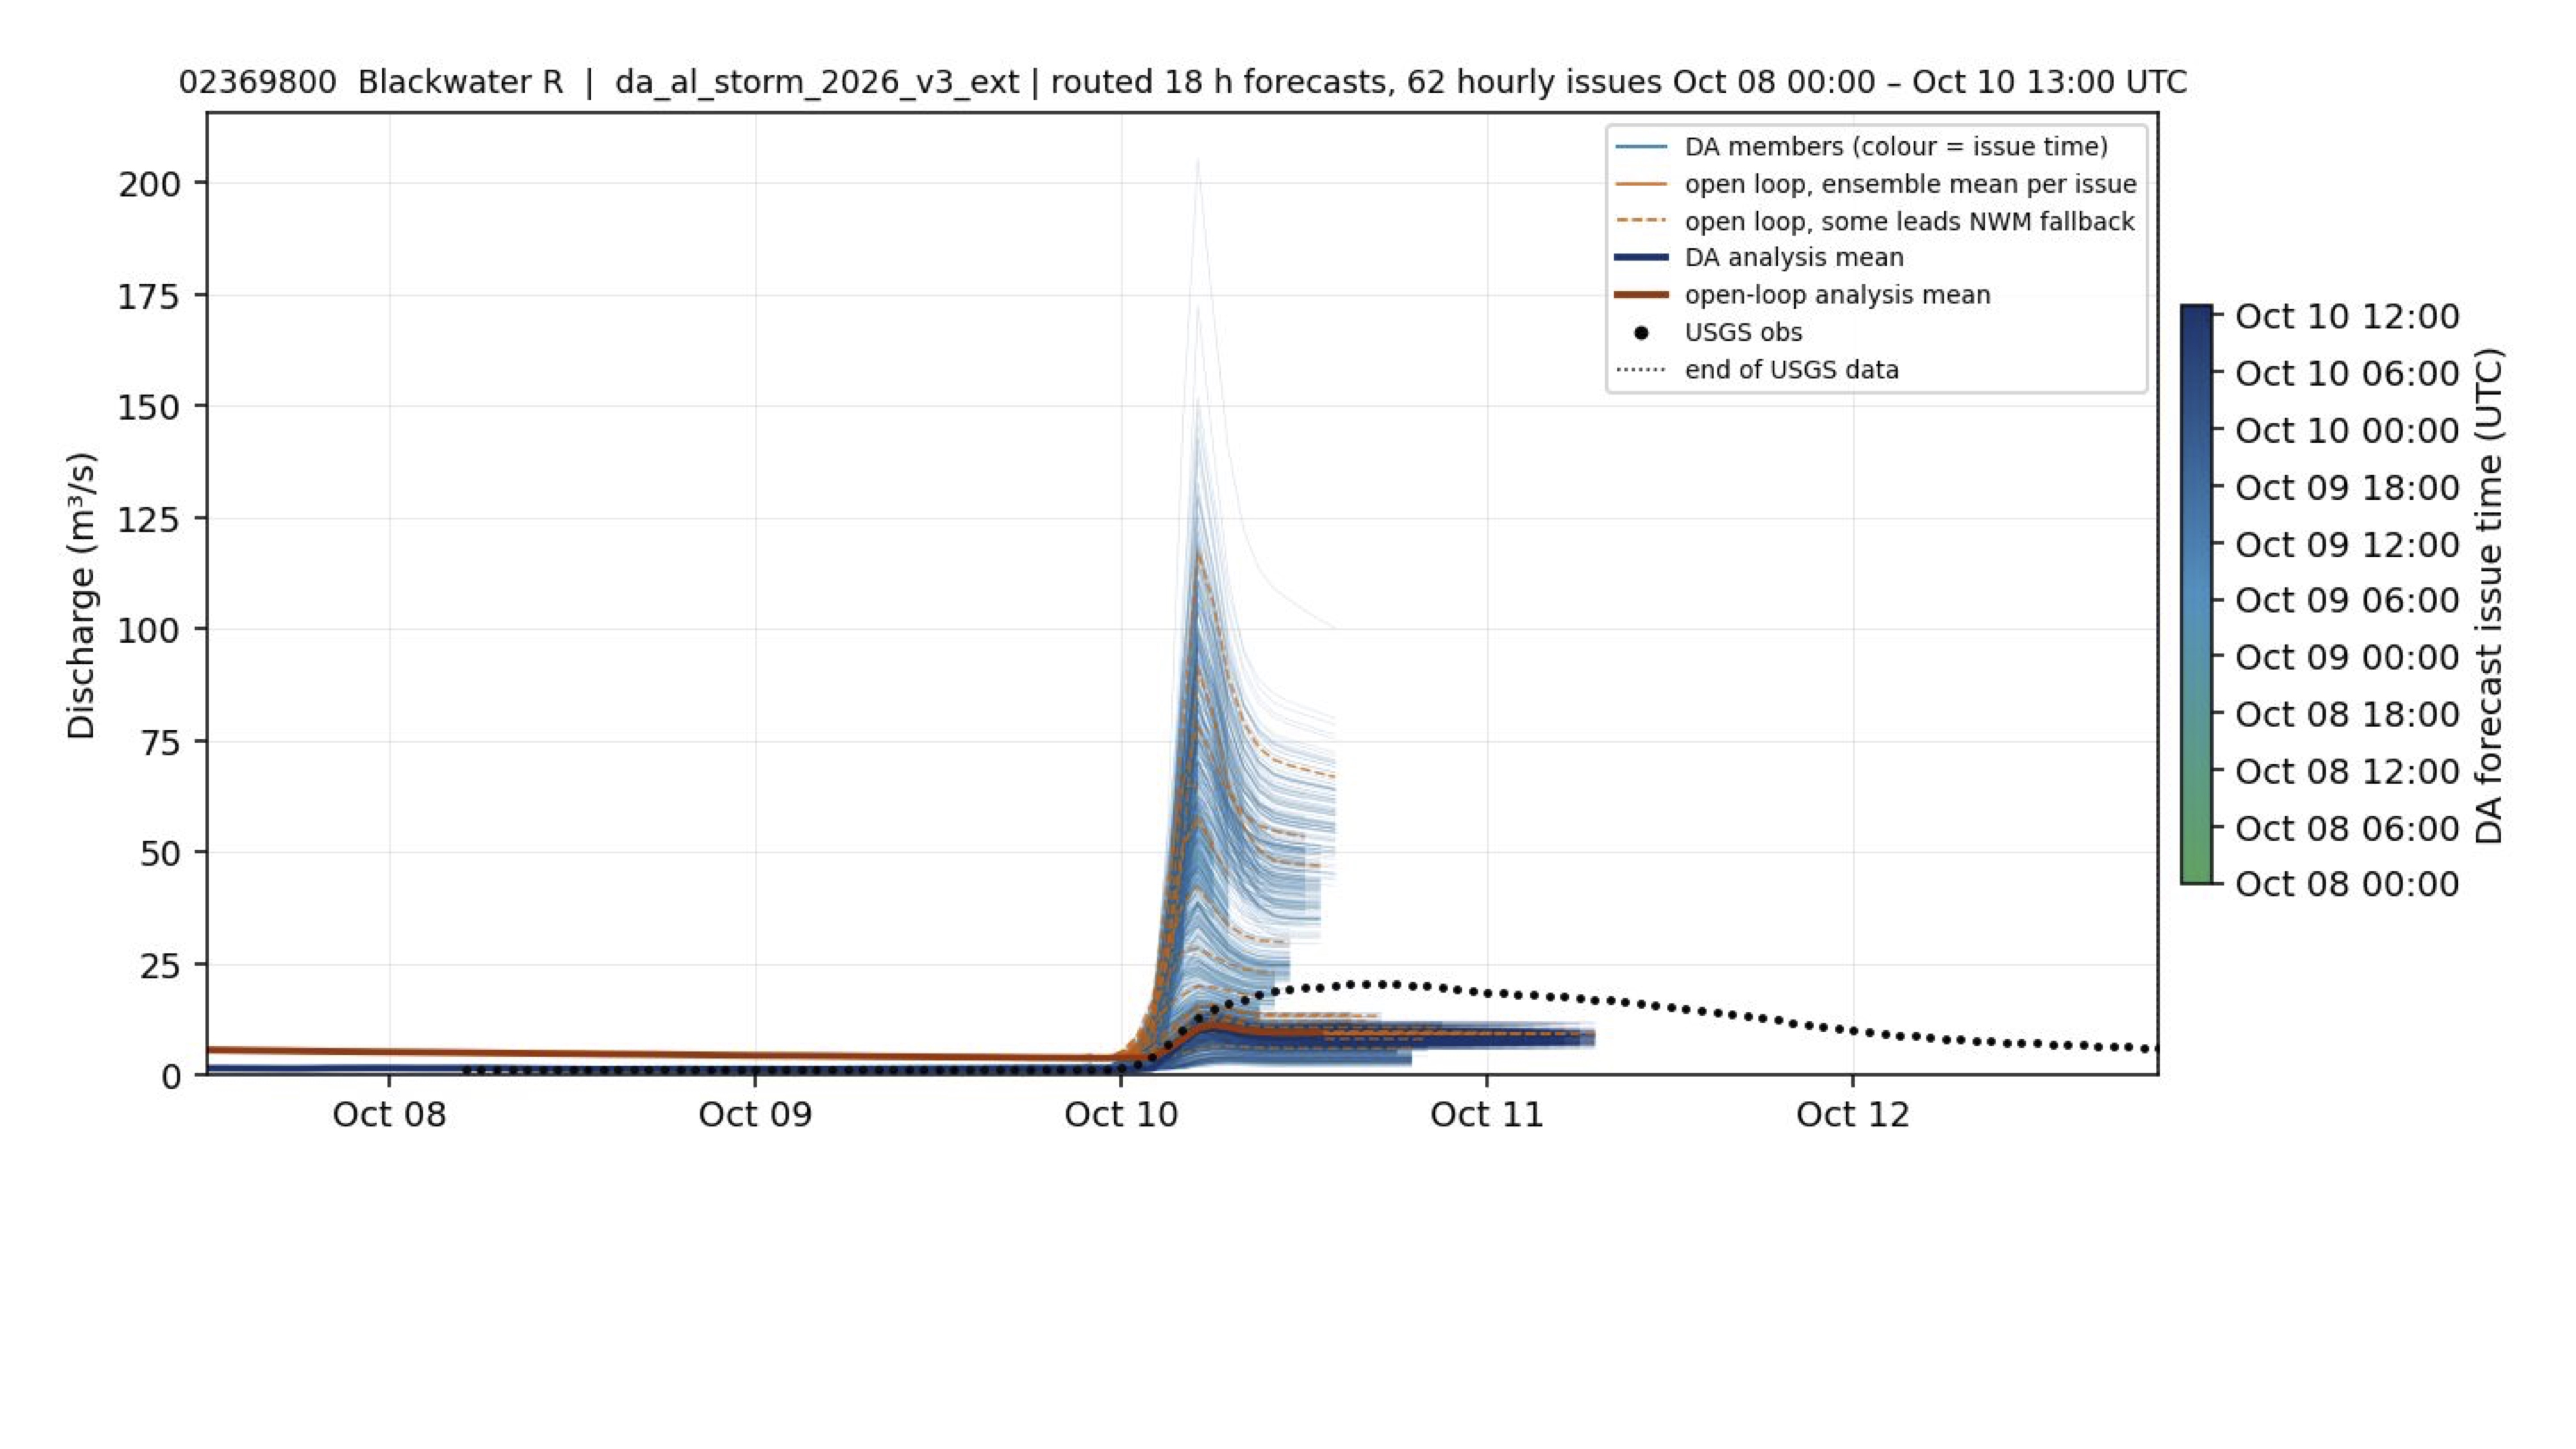
Blackwater bordered the far-southeastern rainfall maximum, but much of the heaviest rain fell outside its basin. Its observed peak near 12.5 m³/s on October 10 was near the low end of a very broad forecast range, followed by a steady recession.
3. Conecuh River at Brantley
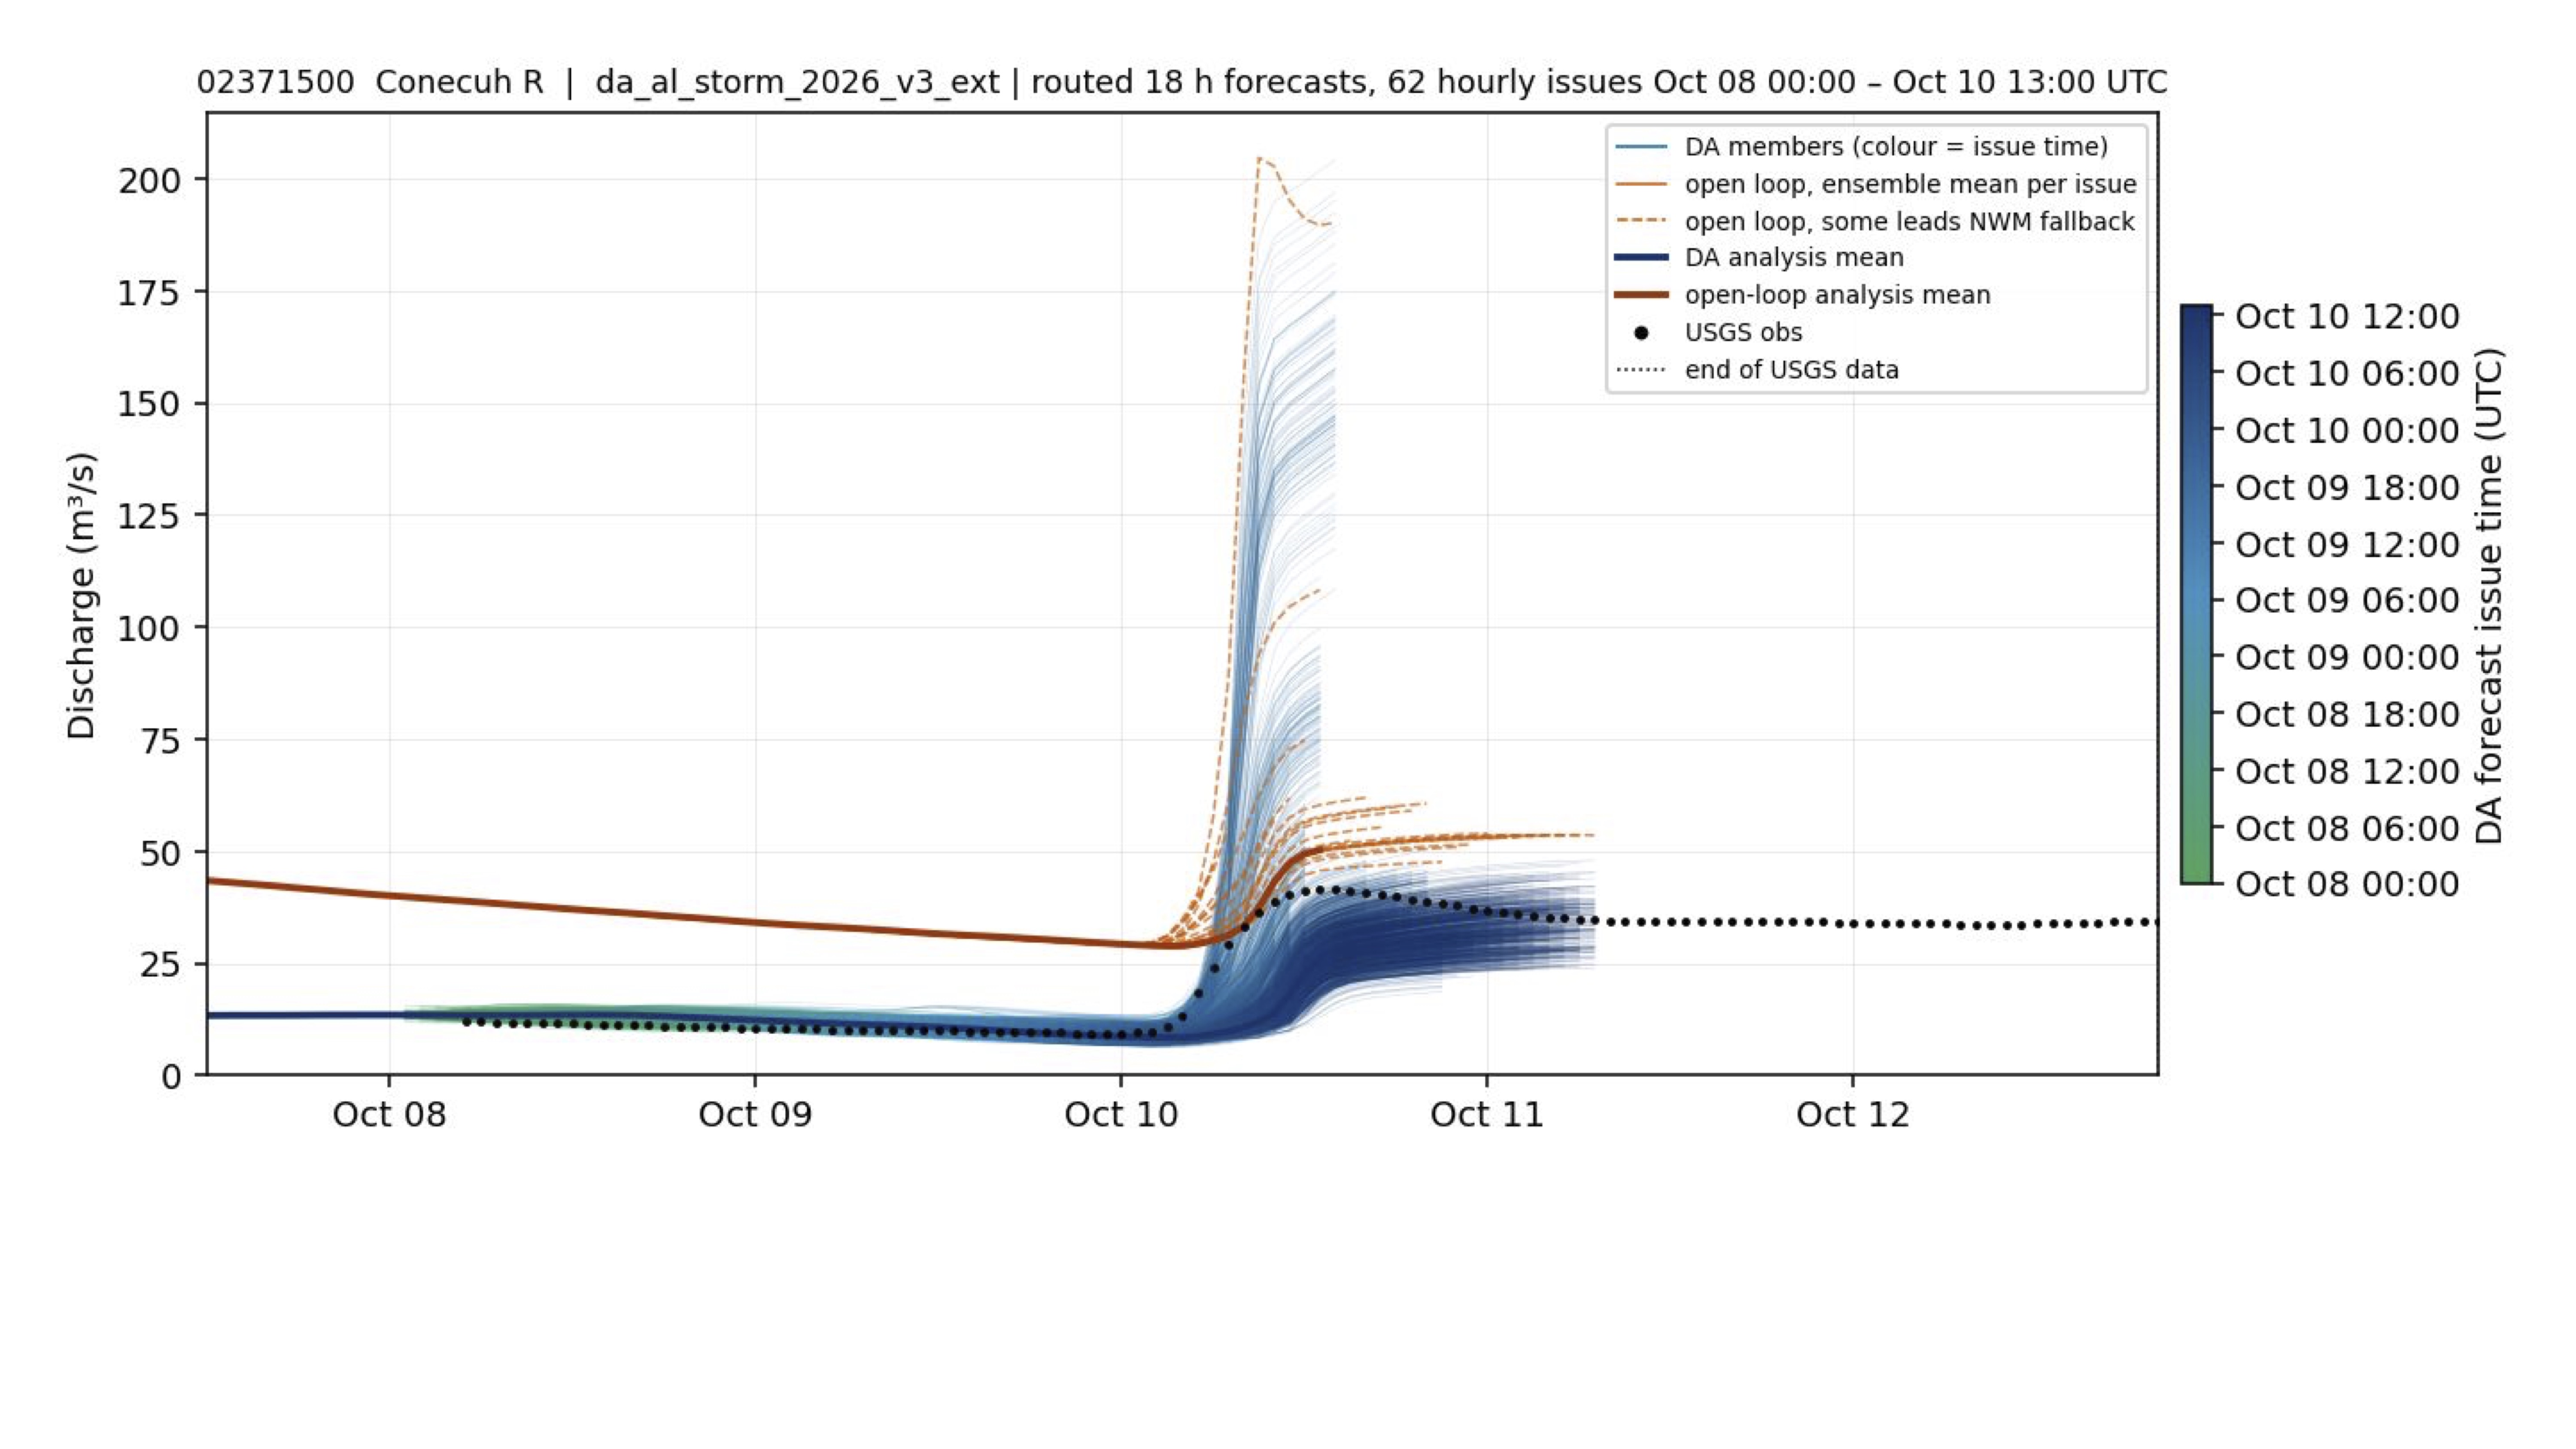
Conecuh also skirted the heavy-rain core rather than receiving its full forecast footprint. The later forecasts converged near the observed 25-35 m³/s and held close through October 12; the earliest forecasts were much too high.
4. Patsaliga Creek near Brantley
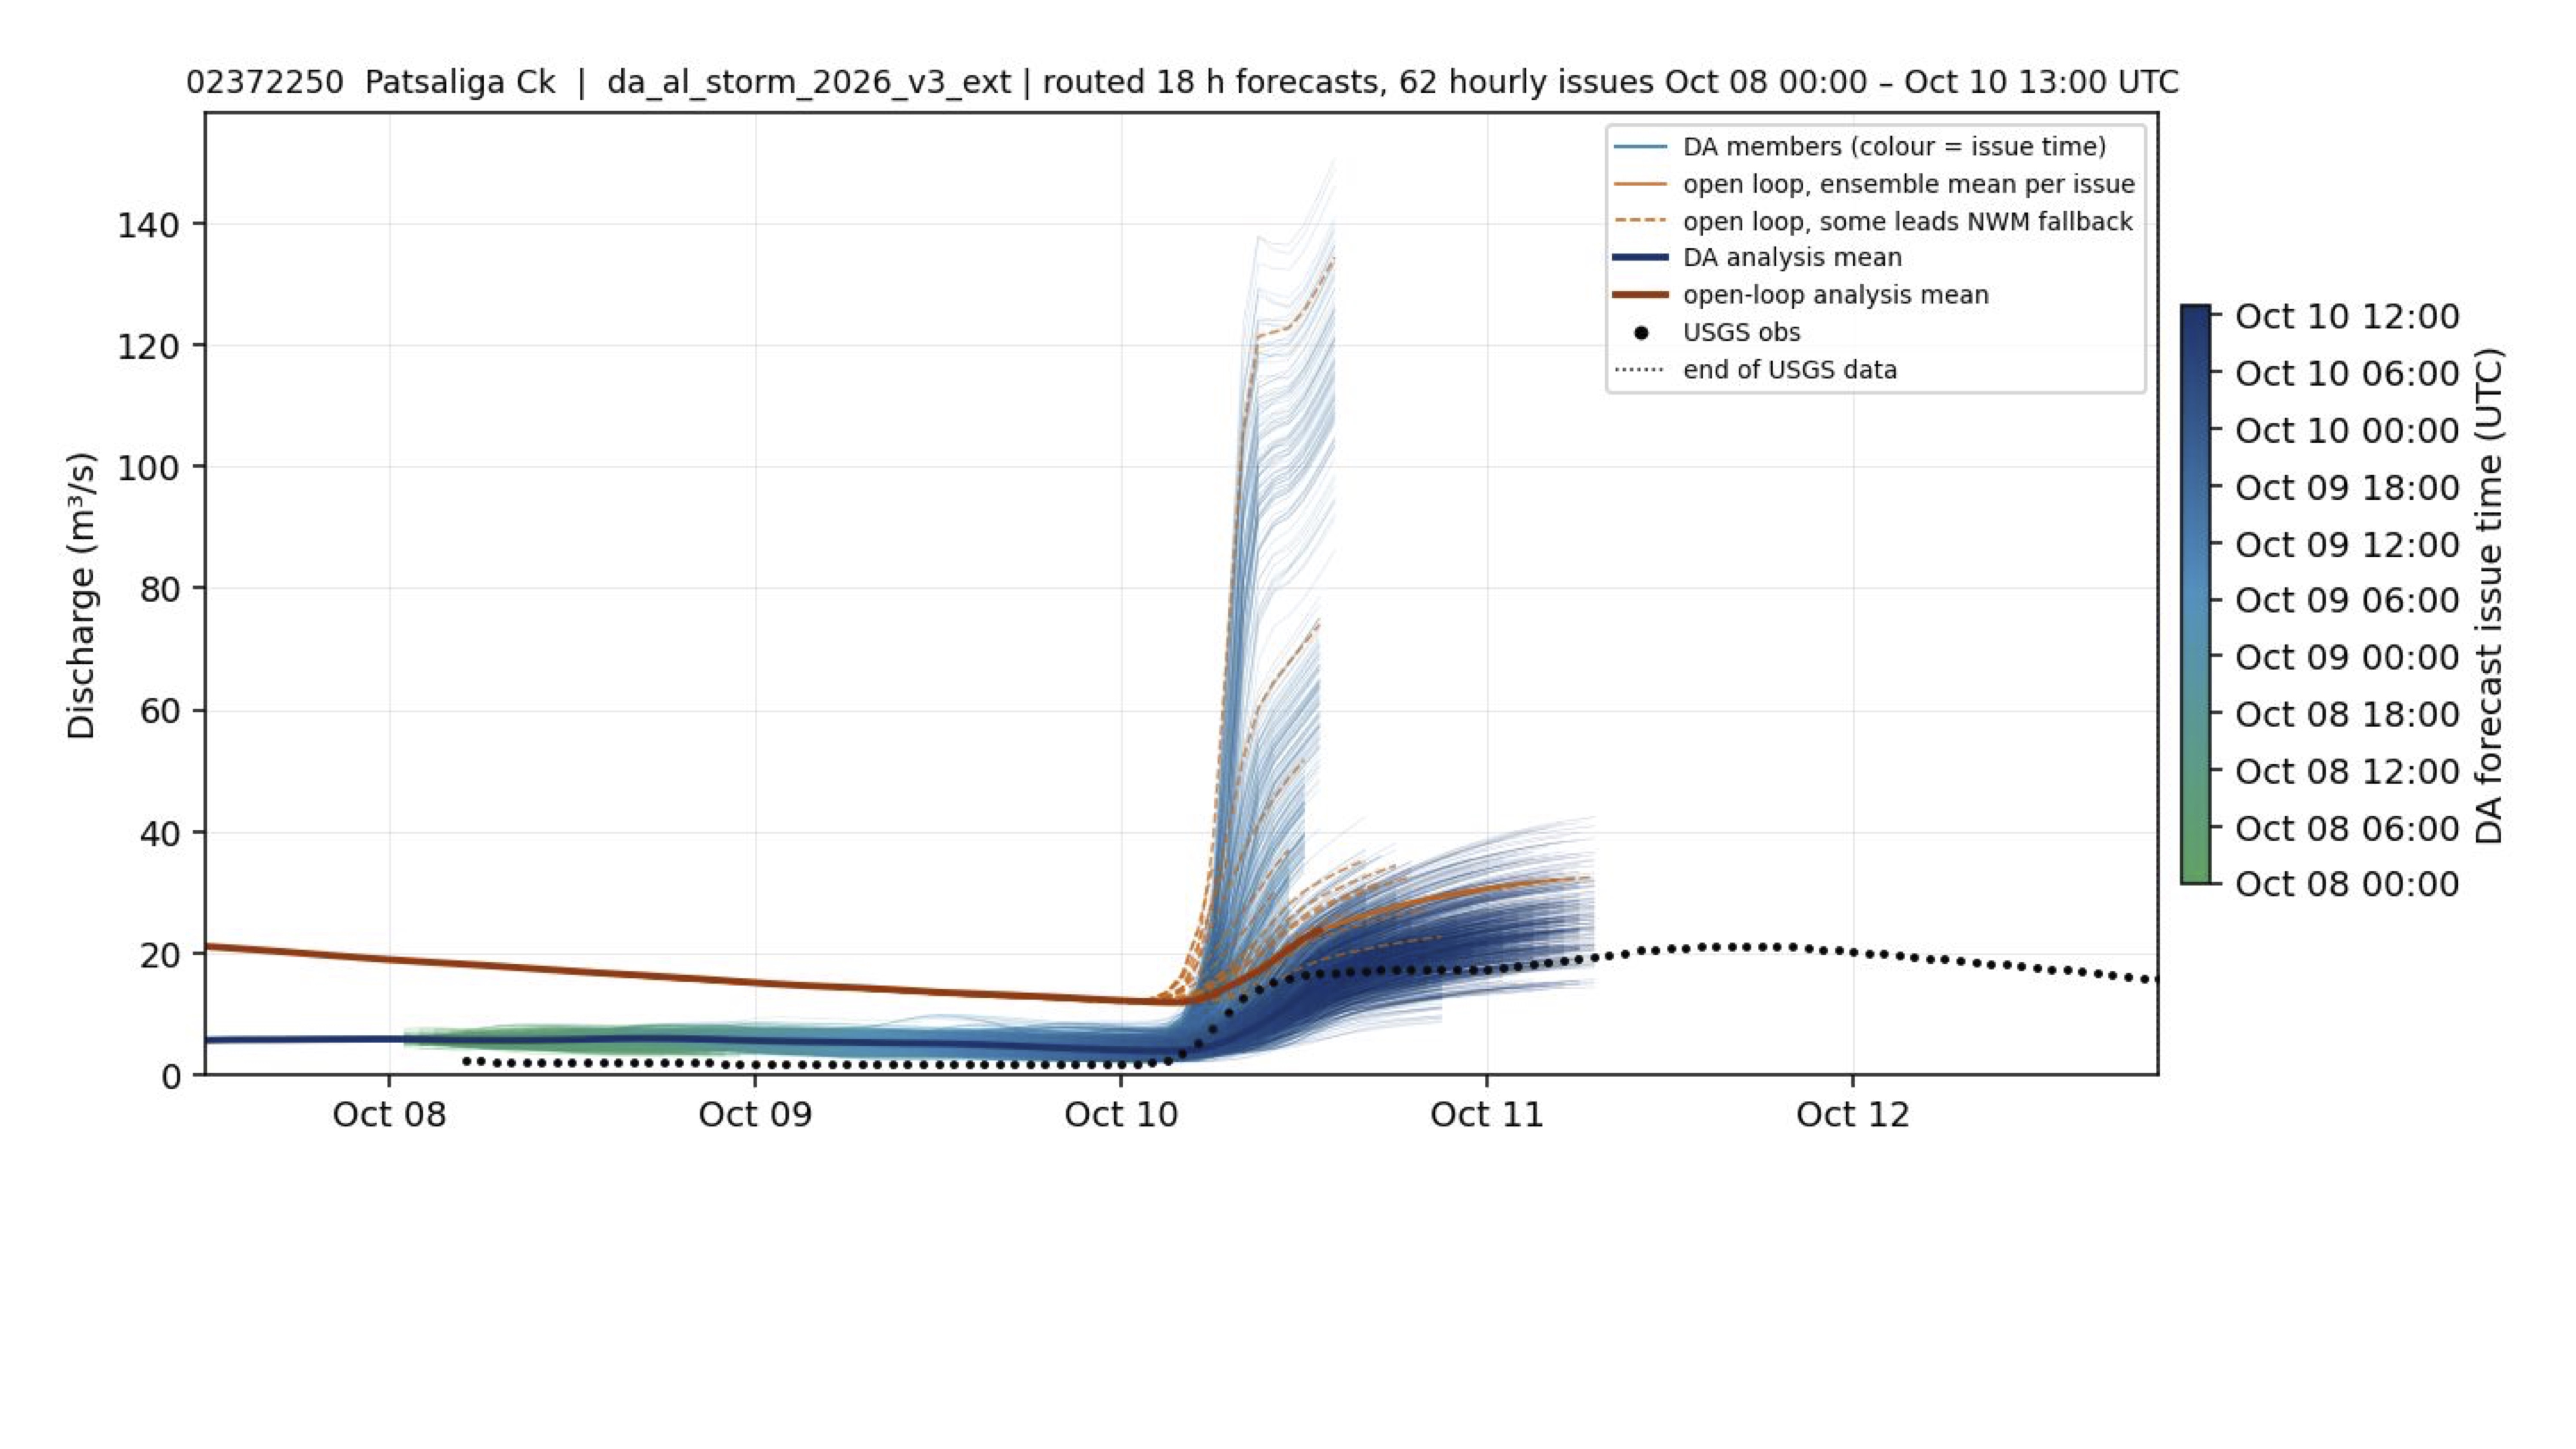
The heaviest rain passed between Patsaliga and the neighboring southeastern basins. After an initial peak near 18 m³/s, observations rose gradually to about 22 m³/s on October 11; the later forecasts captured this modest response much better than the early, widely spread issues.
5. Murder Creek near Evergreen
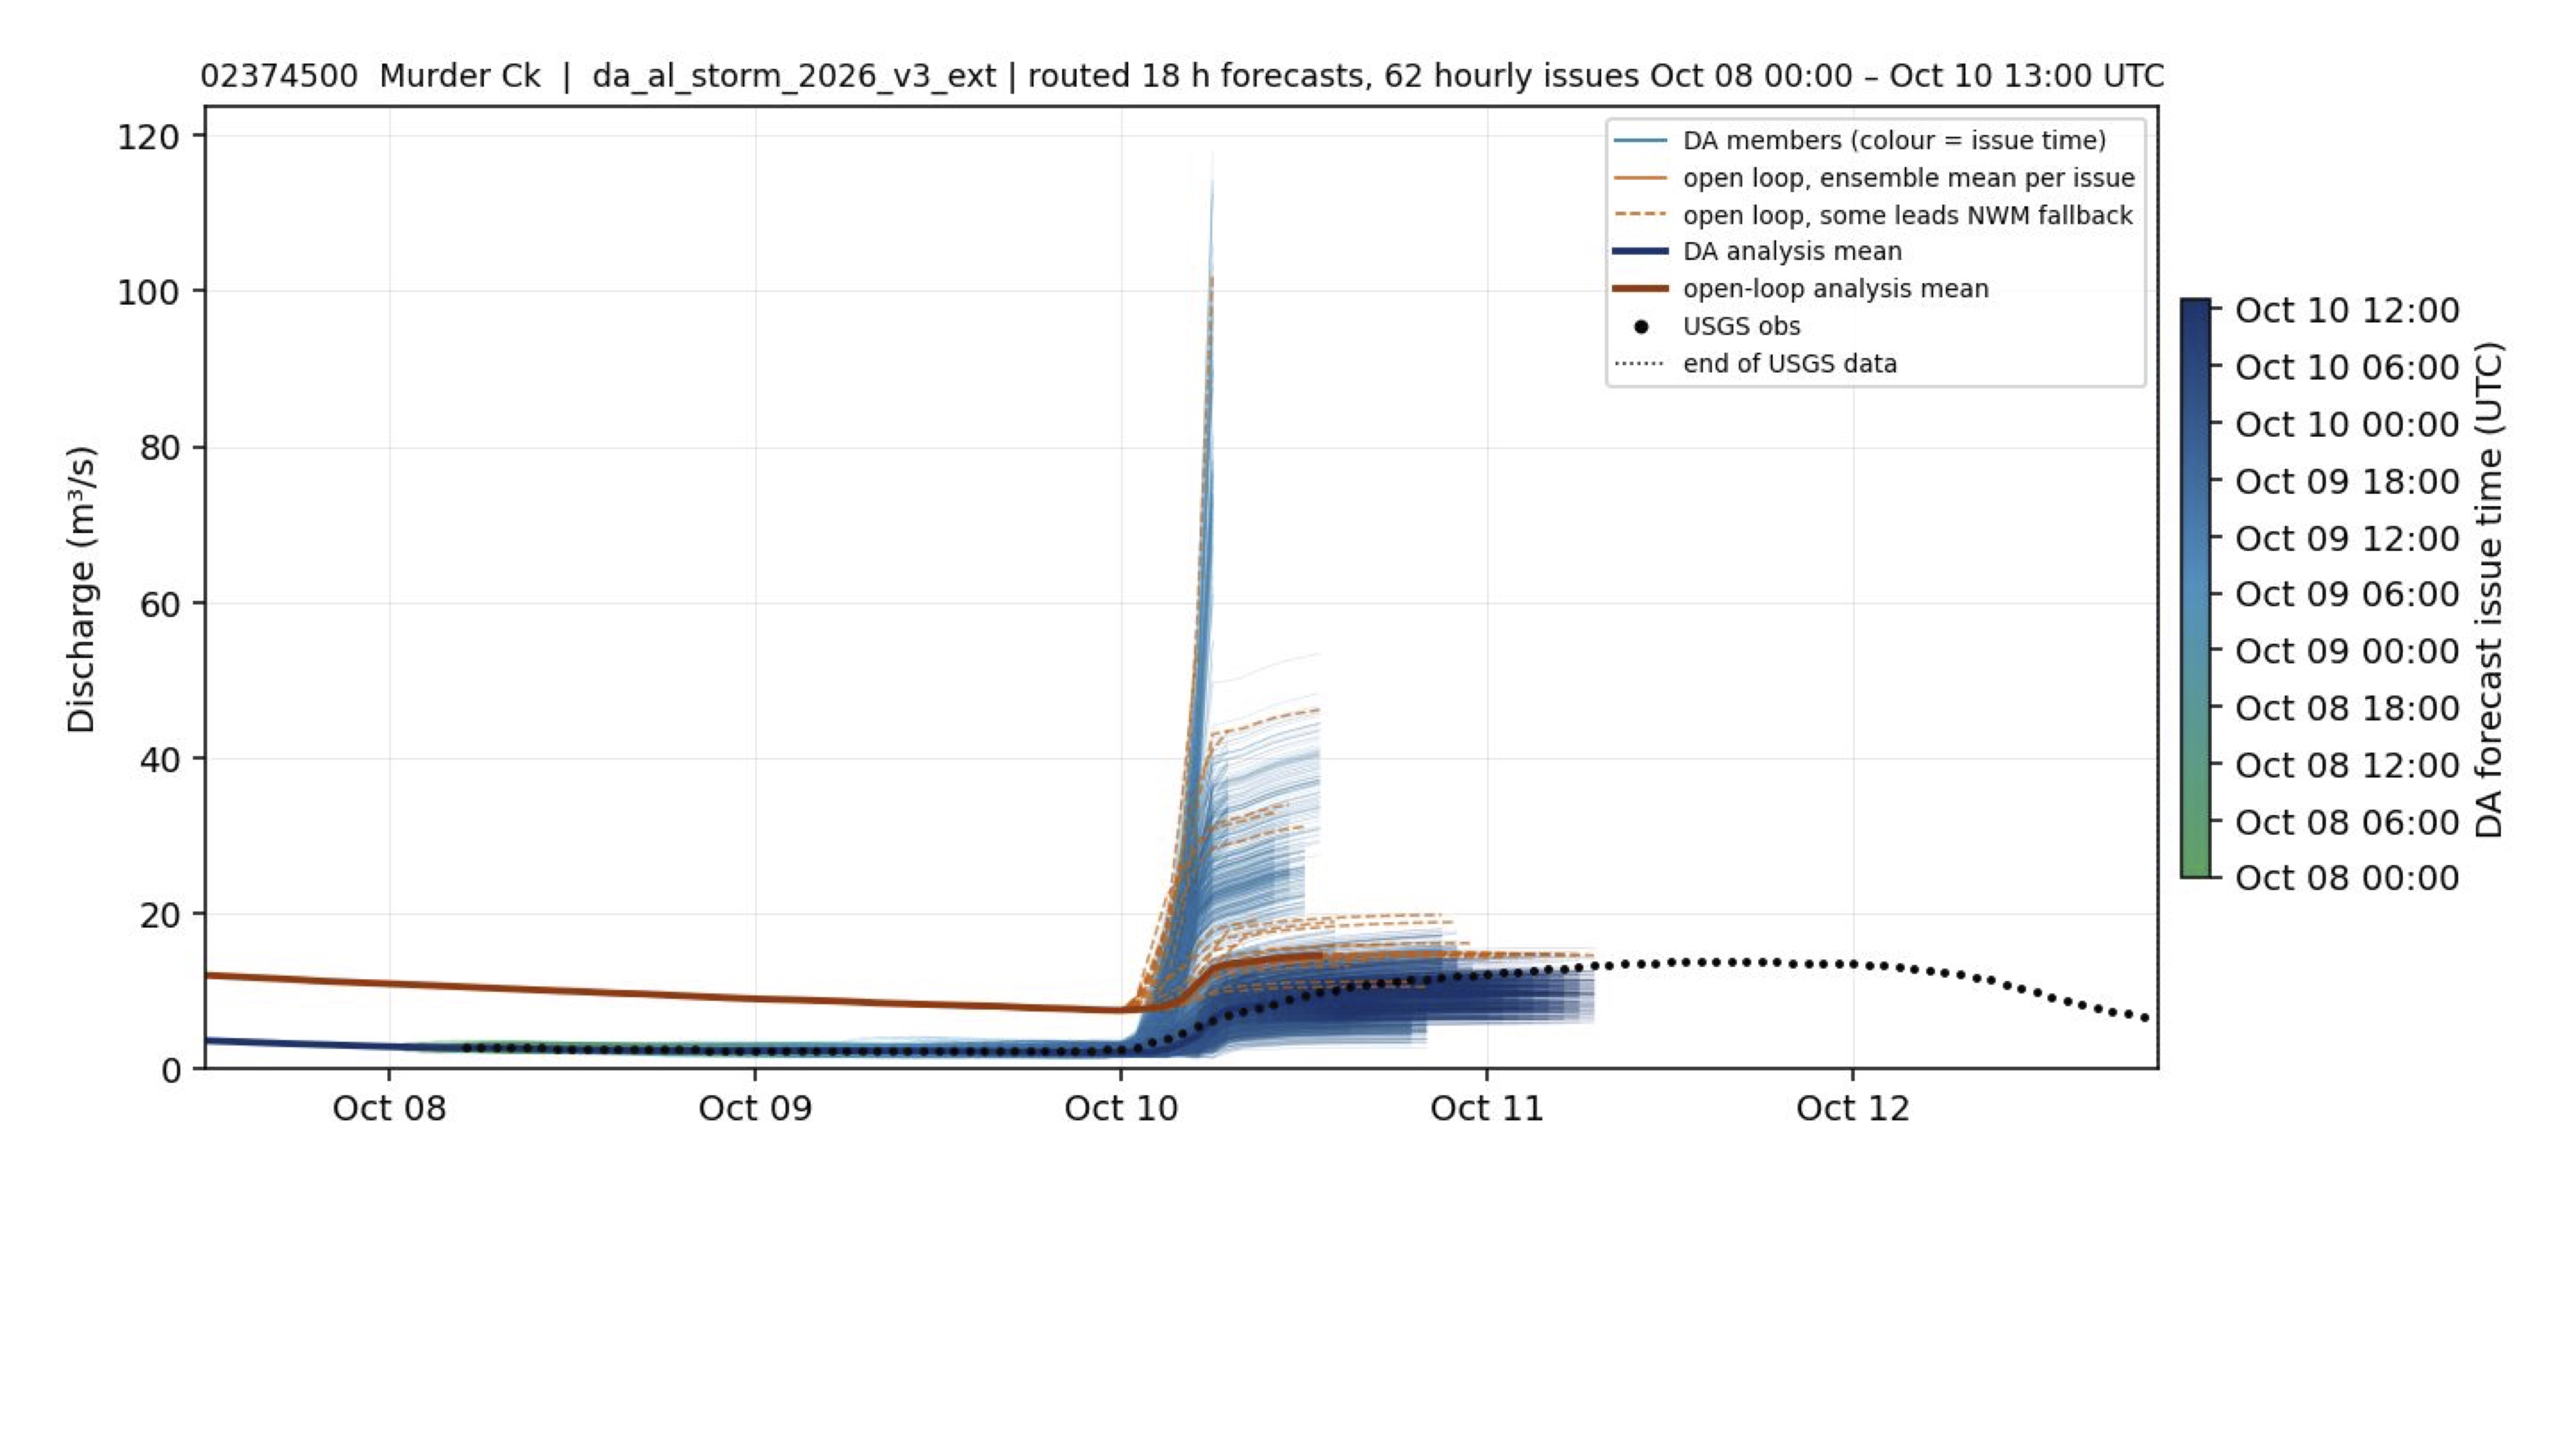
Murder Creek lay along the edge of the southeastern rainfall maximum. Its slow rise to about 17 m³/s aligned well with the later forecasts, while the early issues projected a much larger response than the basin received.
6. Hatchet Creek below Rockford
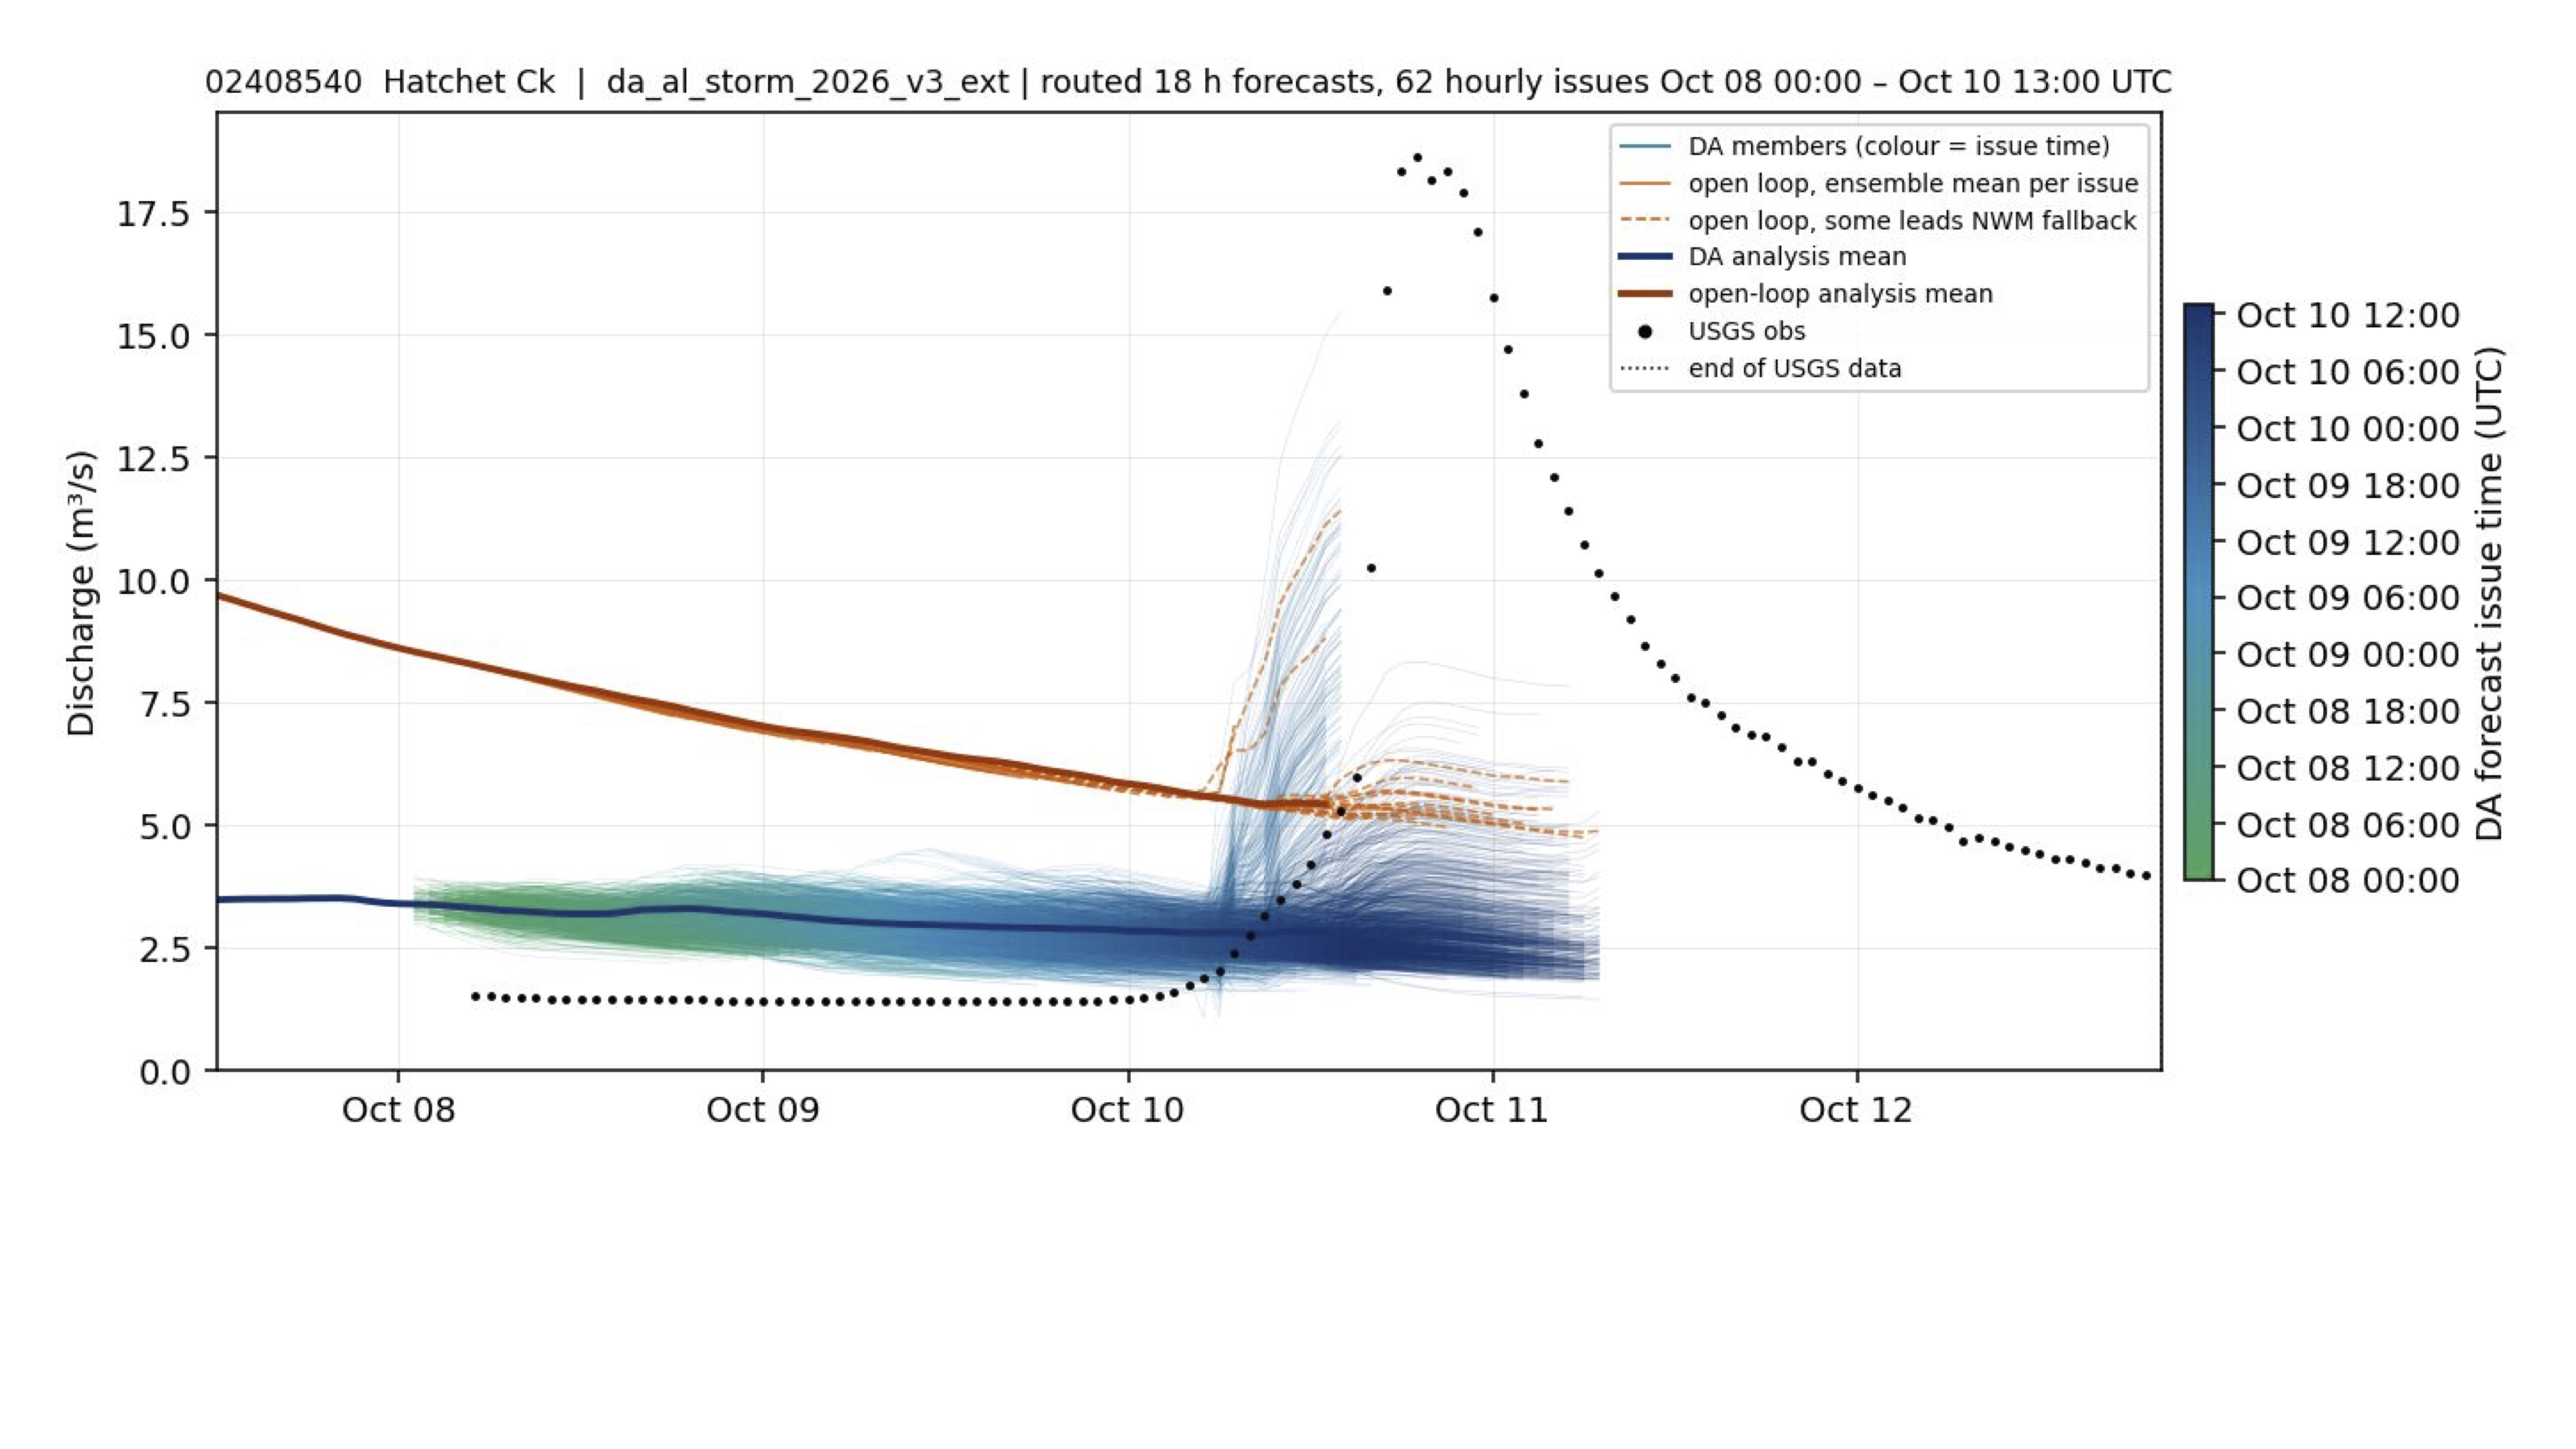
Hatchet Creek was outside the mapped extreme-rain core, yet USGS flow surged to roughly 17.5 m³/s. This was the clearest underforecast: both DA and open-loop forecasts missed the peak before the recession through October 13.
7. Mulberry Creek at Jones
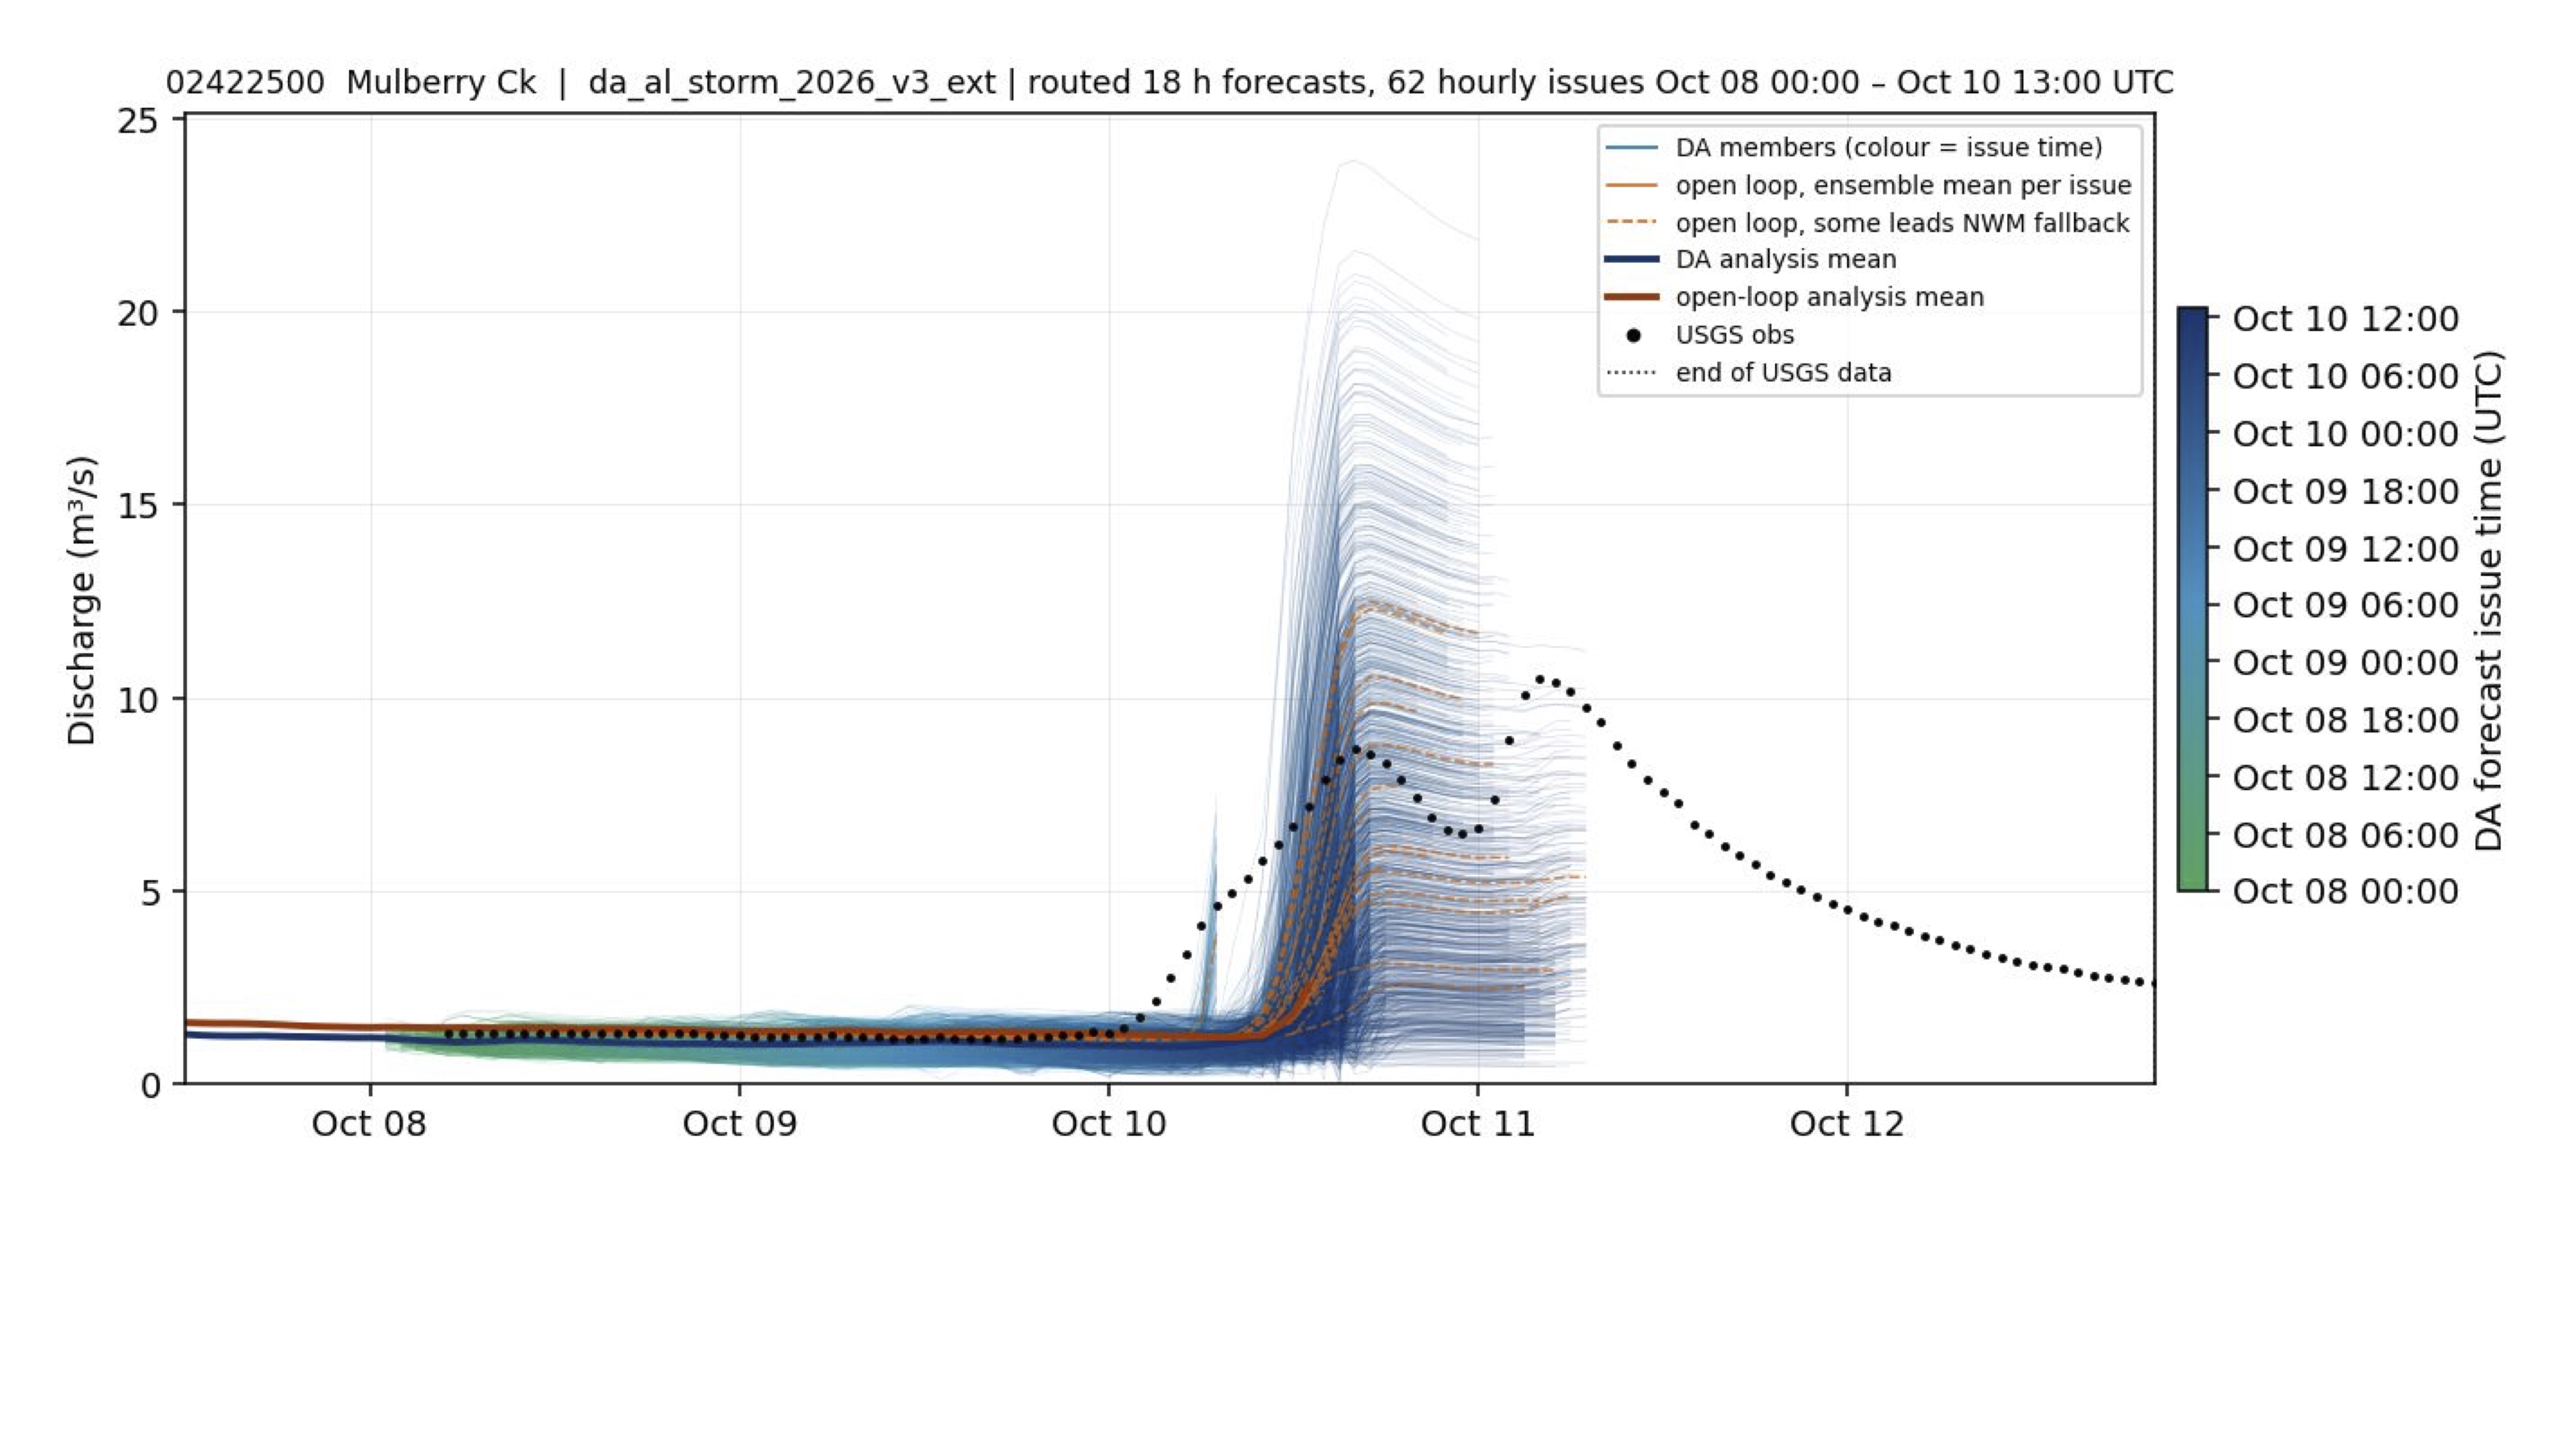
On the western side of the main rain area, Mulberry Creek still produced two modest crests. The first, near 10 m³/s, arrived around the forecast peak; a second near 12 m³/s early on October 11 was less clearly represented.
8. Sipsey Fork near Grayson
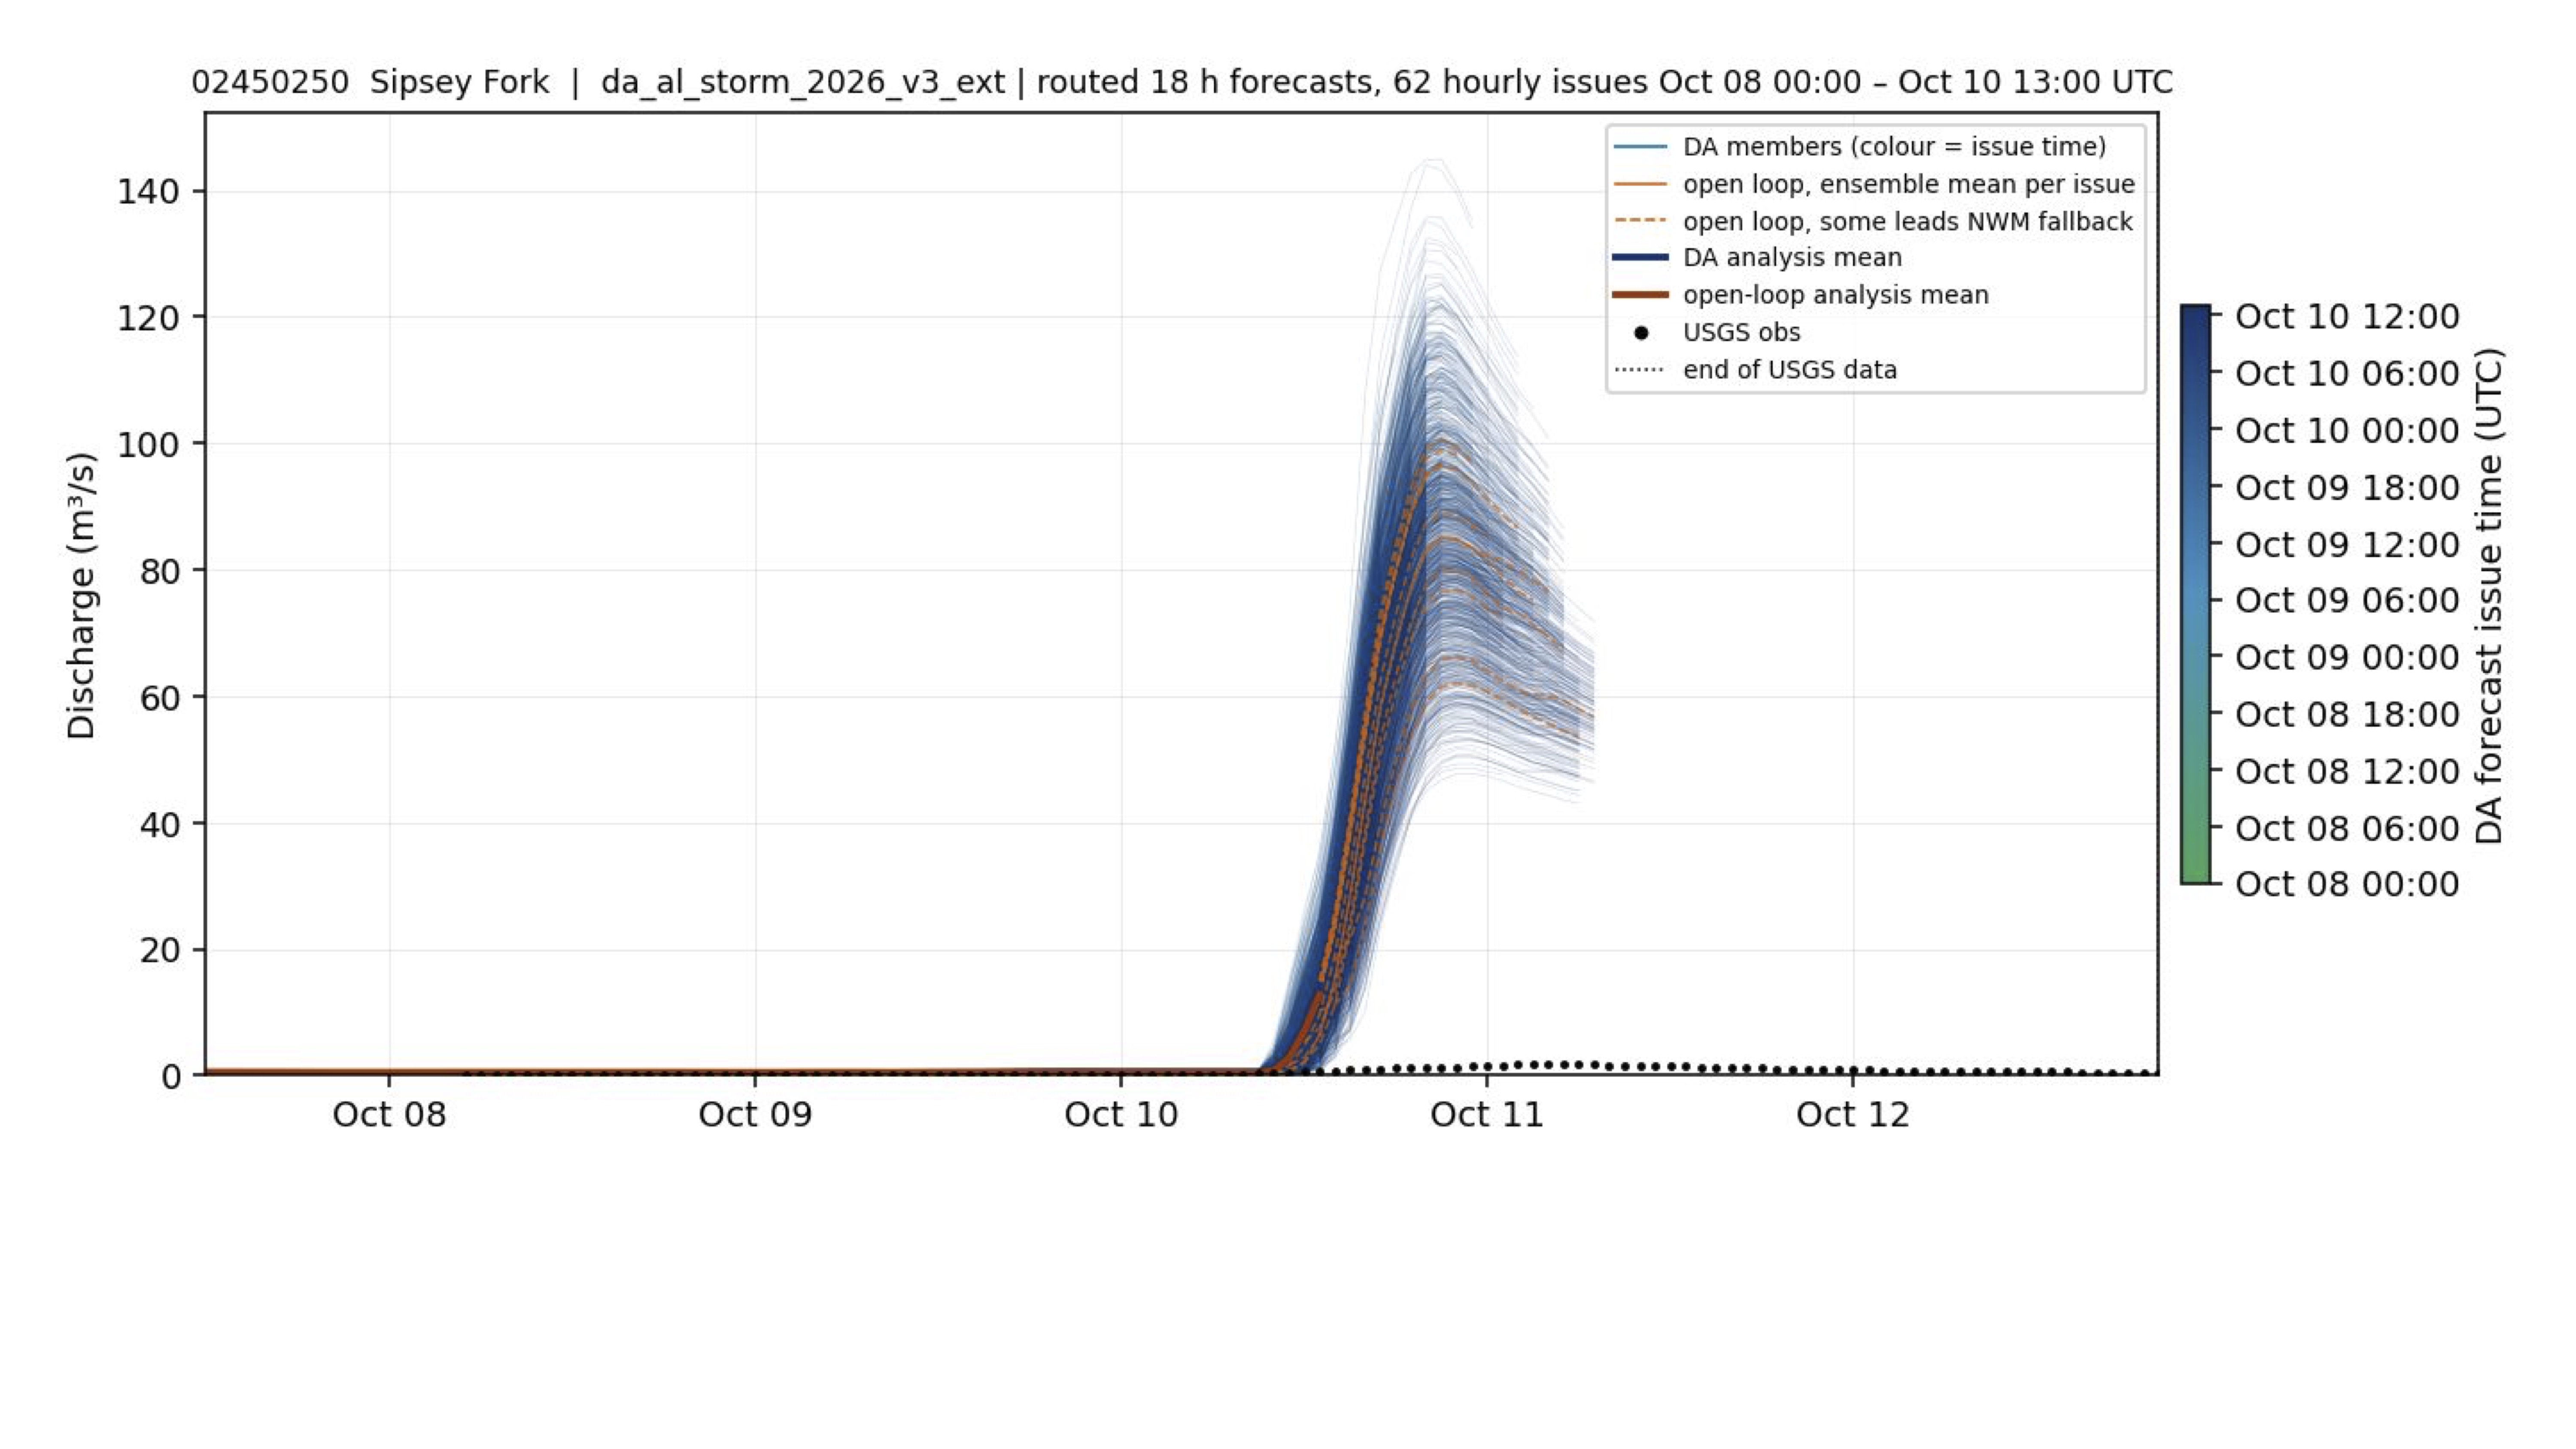
The precipitation map shows only light rain over northwestern Alabama. Both forecast systems nevertheless projected a 40-120 m³/s rise at Sipsey Fork, while the gauge showed only a minimal response—a clear false alarm caused largely by misplaced forecast rainfall.
9. North River near Samantha
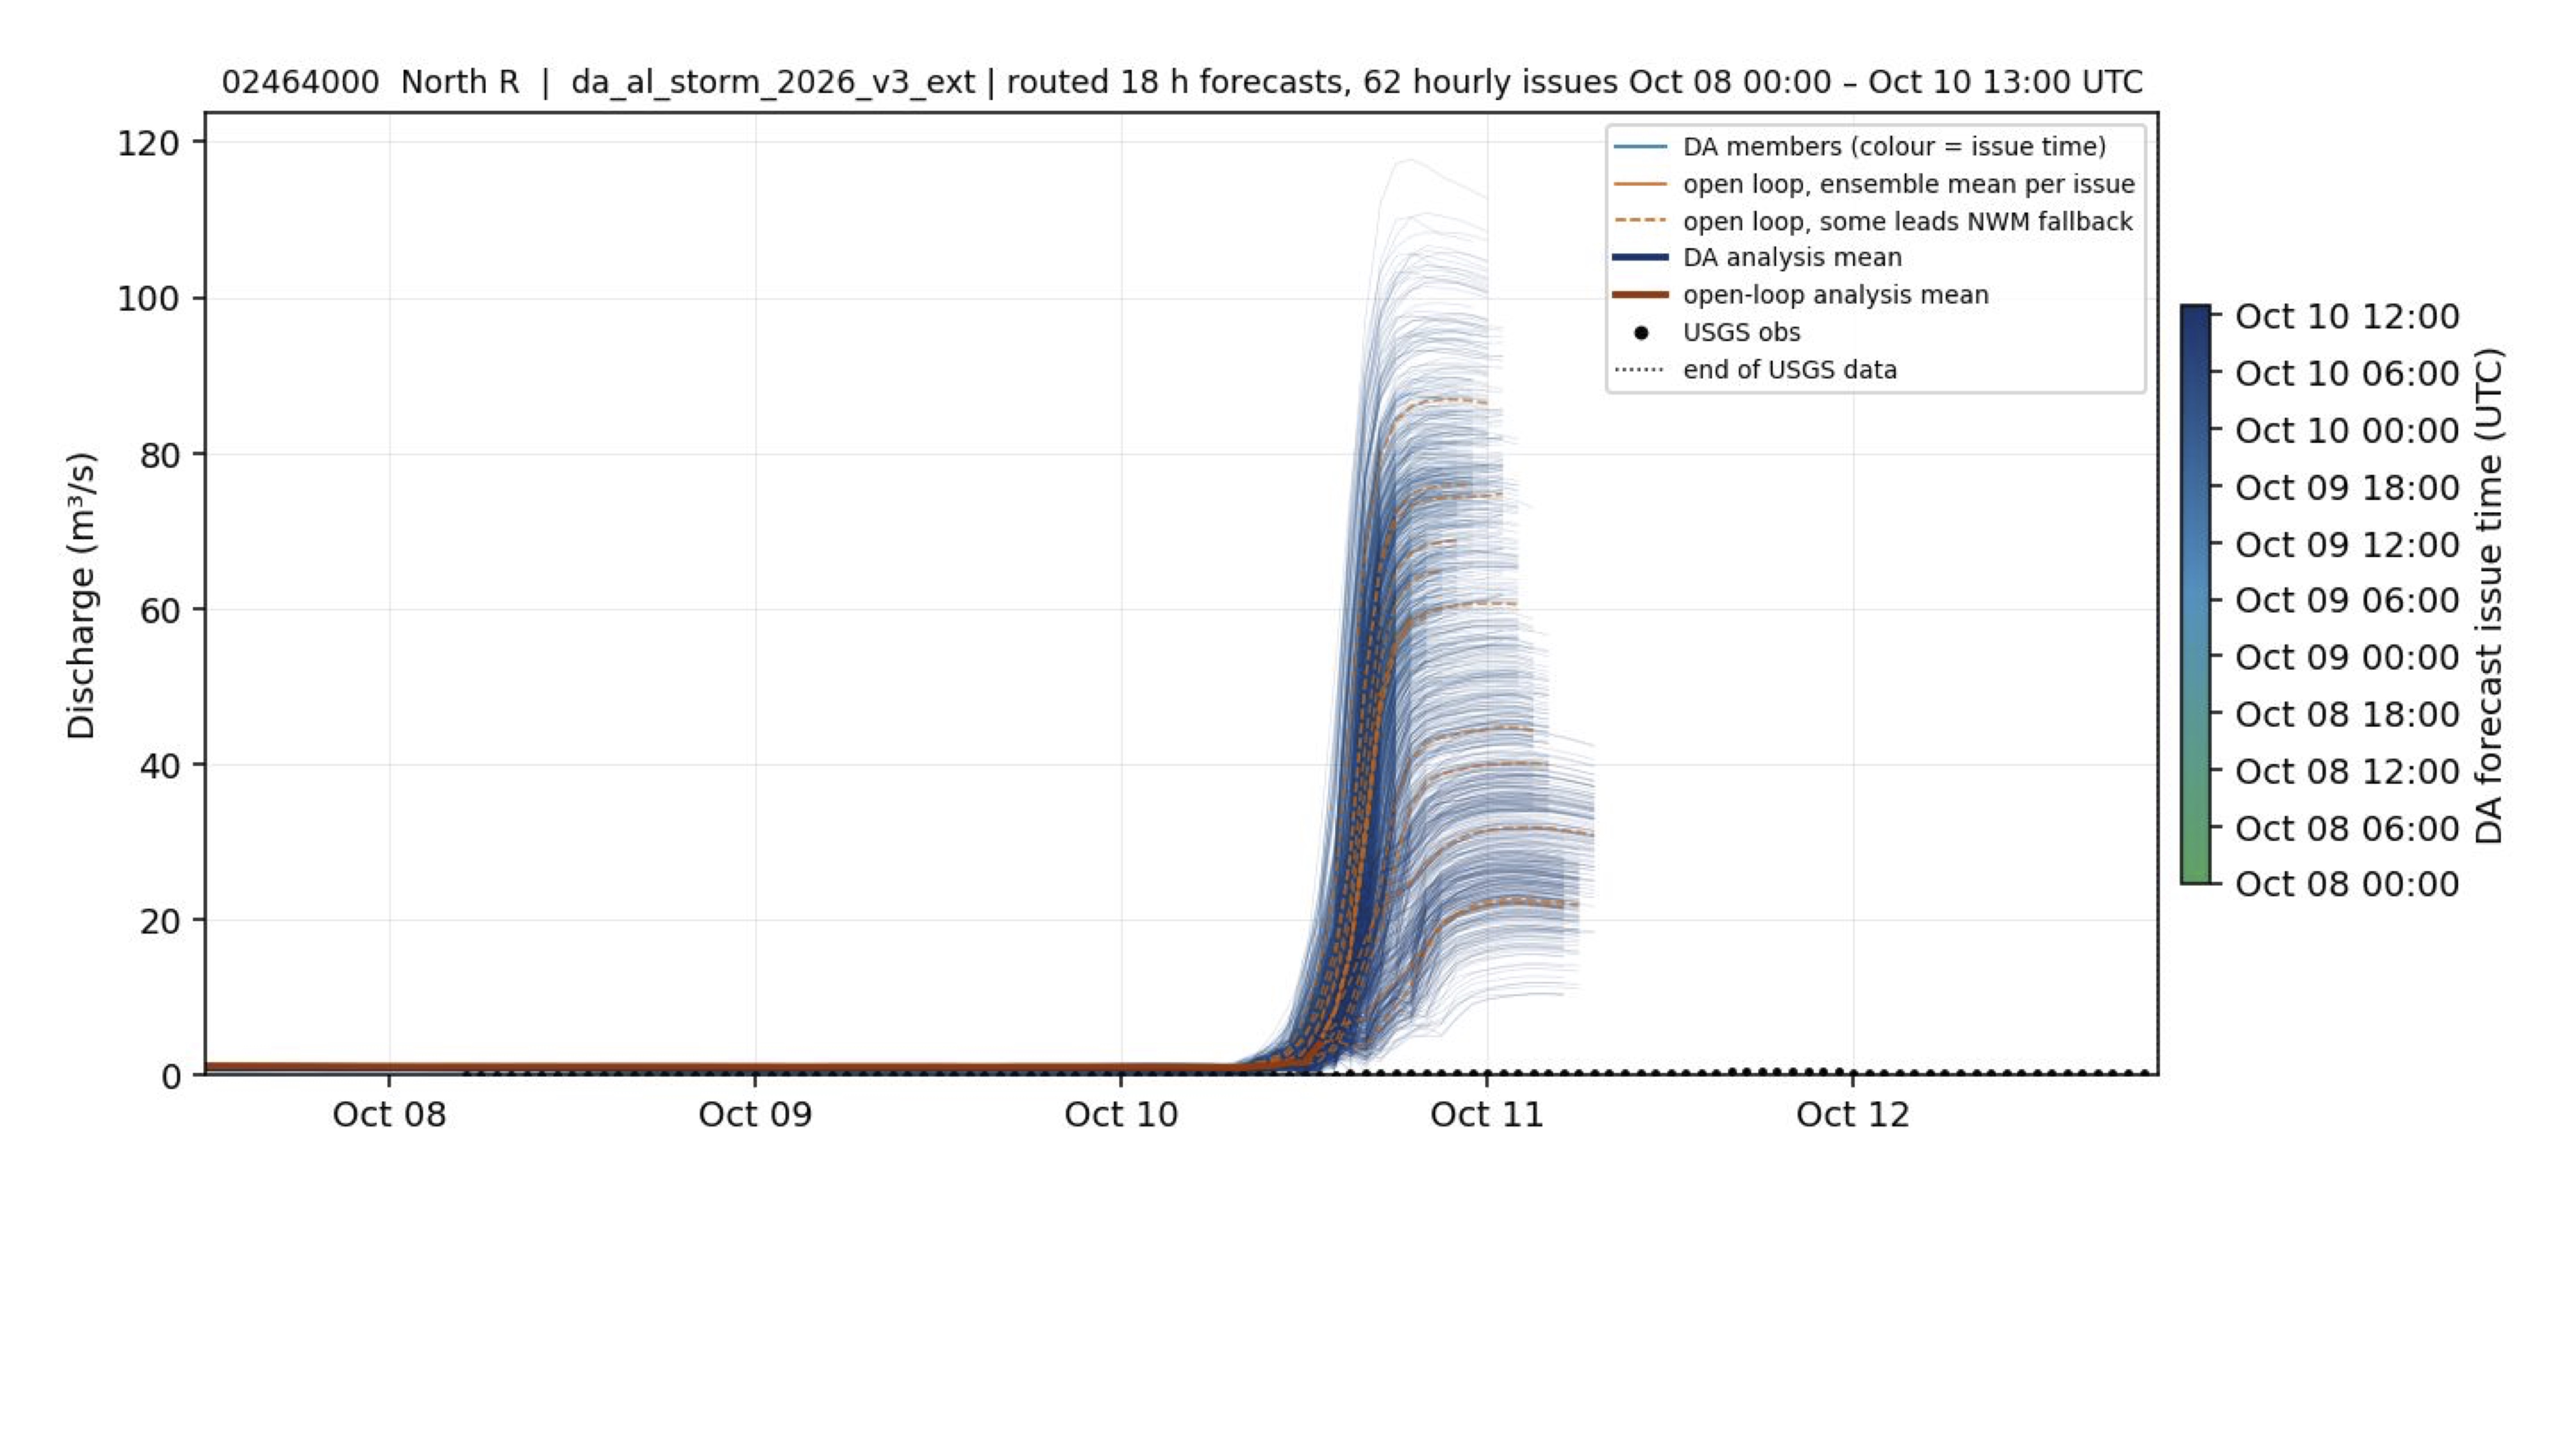
North River was also well west of the storm's concentrated southeastern rainfall. The forecast rise of roughly 10-100 m³/s did not occur, and observed flow remained near zero.
10. Elliotts Creek at Moundville
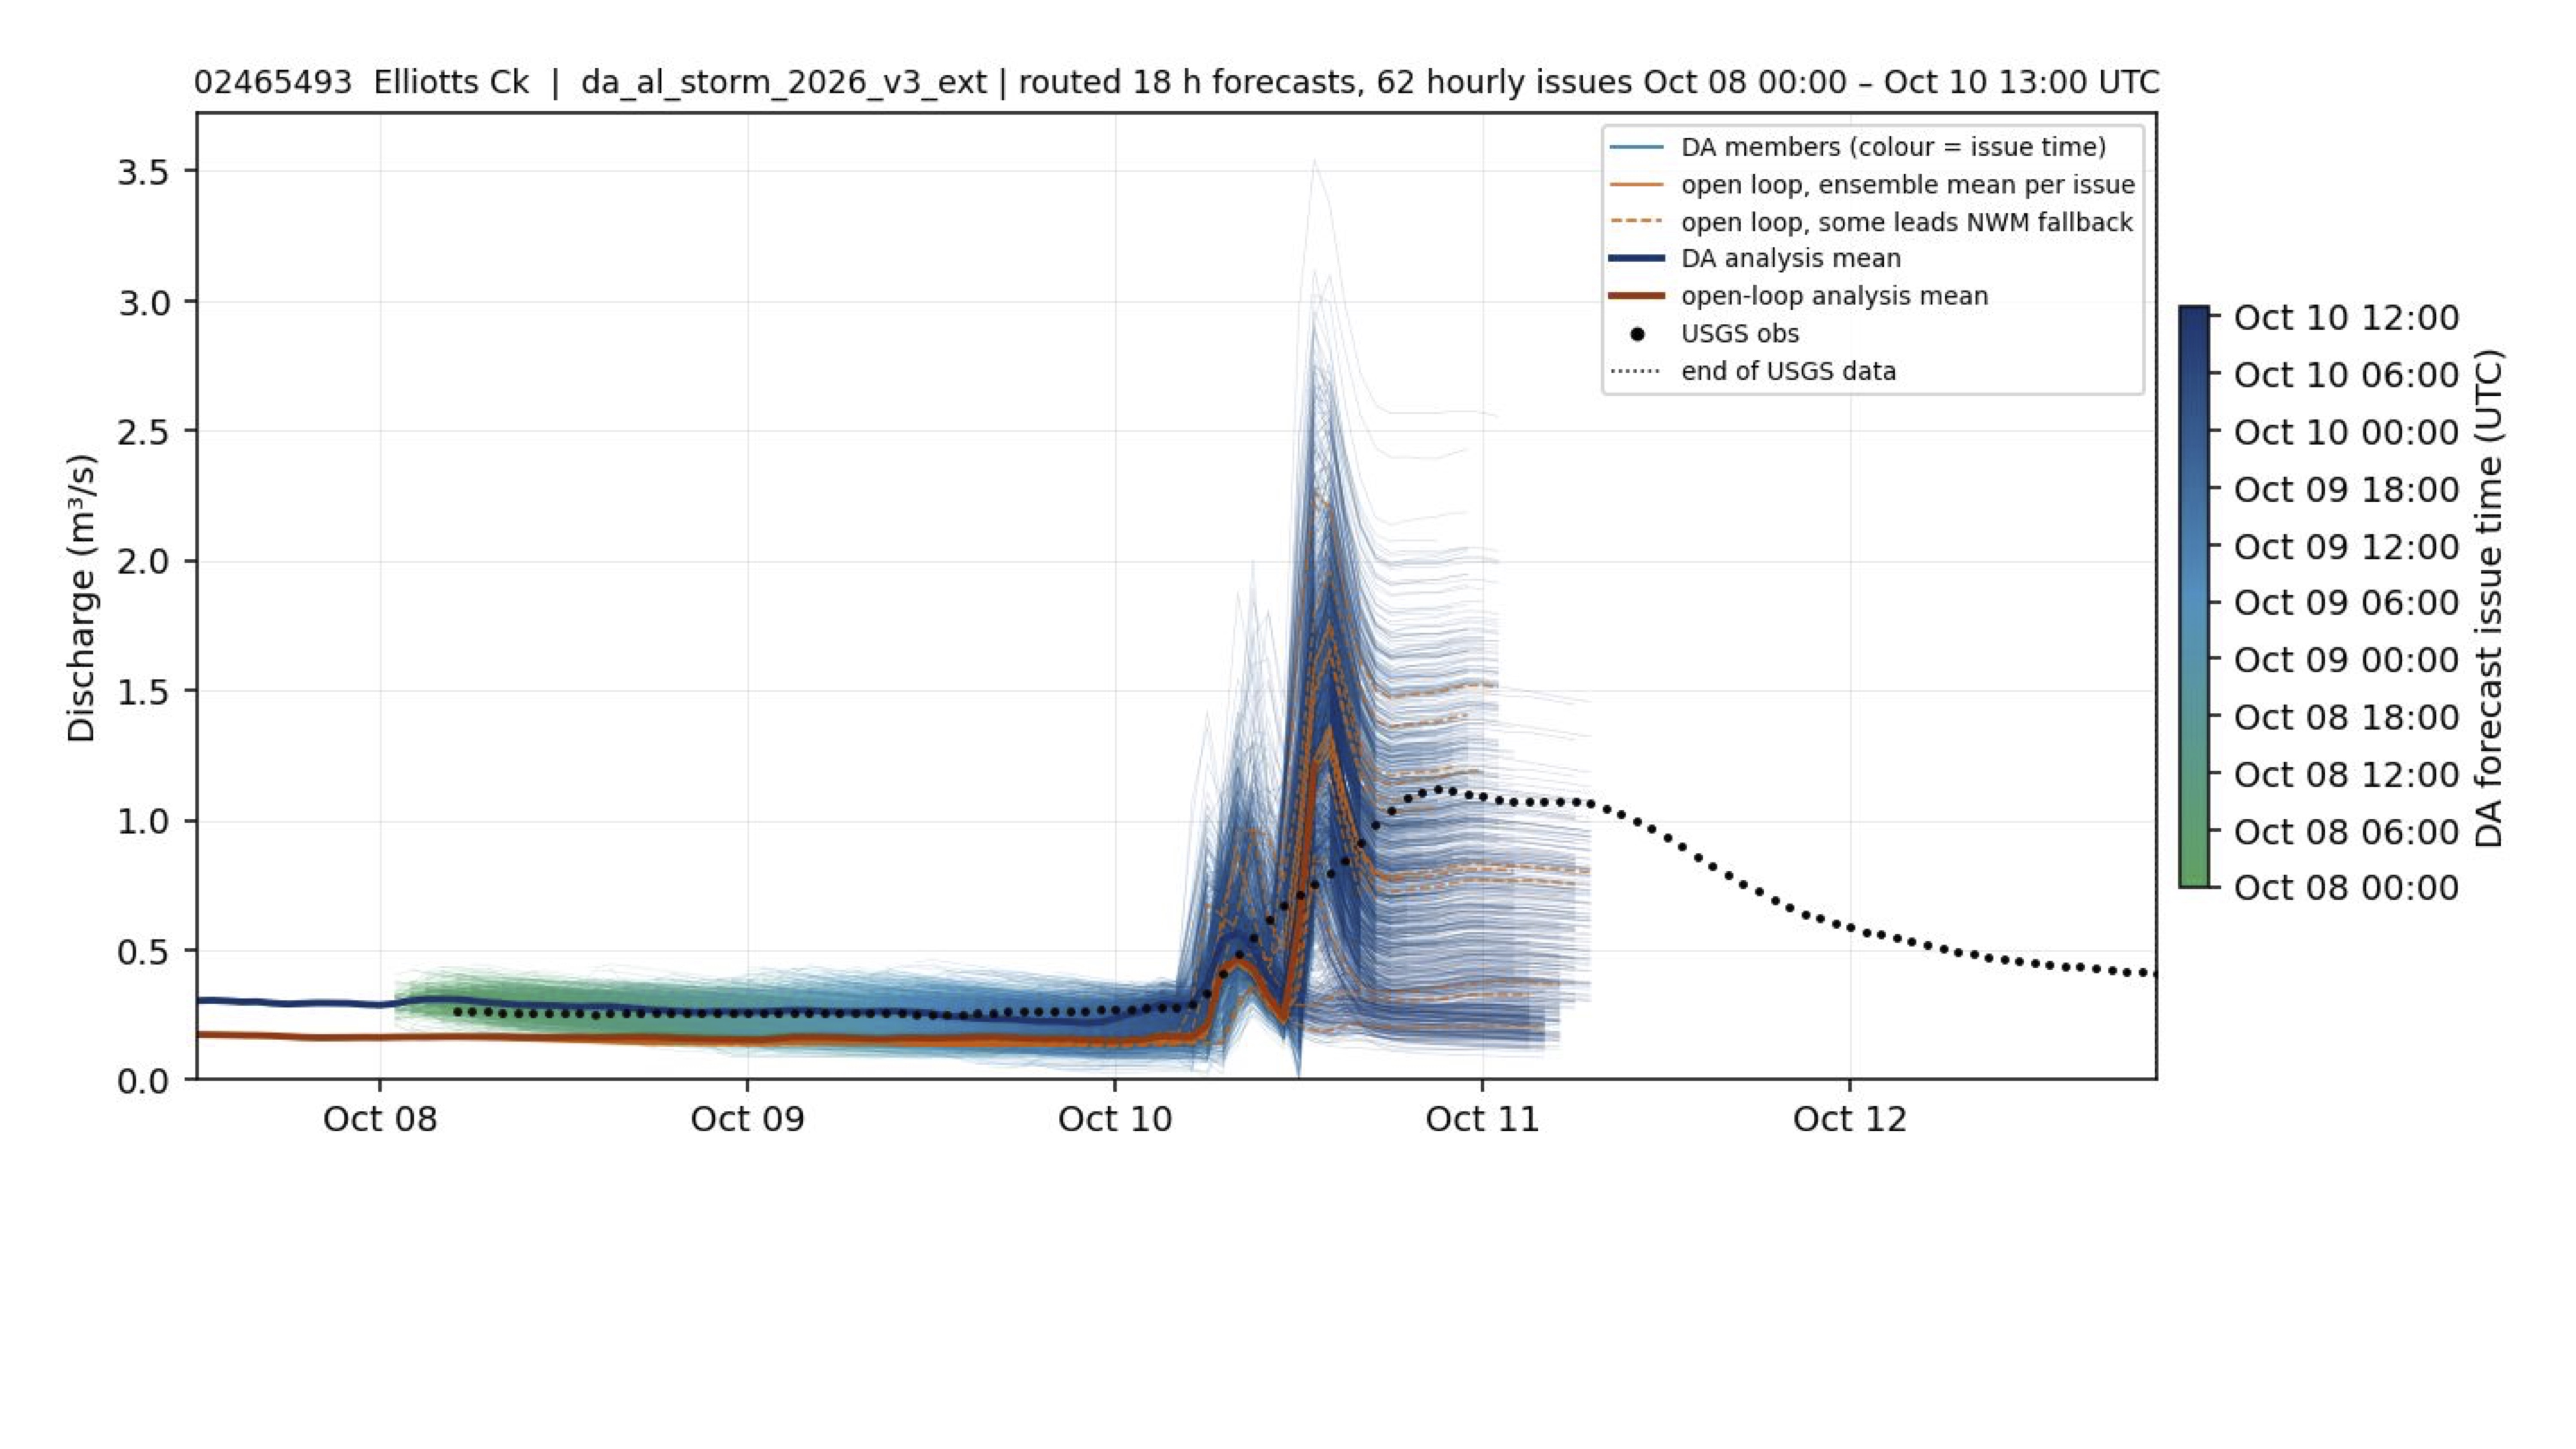
Light rainfall over western Alabama limited the response at Elliotts Creek. The forecasts produced two pulses as high as about 3 m³/s, but USGS recorded one smaller peak near 1.25 m³/s just before October 11.
11. Satilpa Creek near Coffeeville
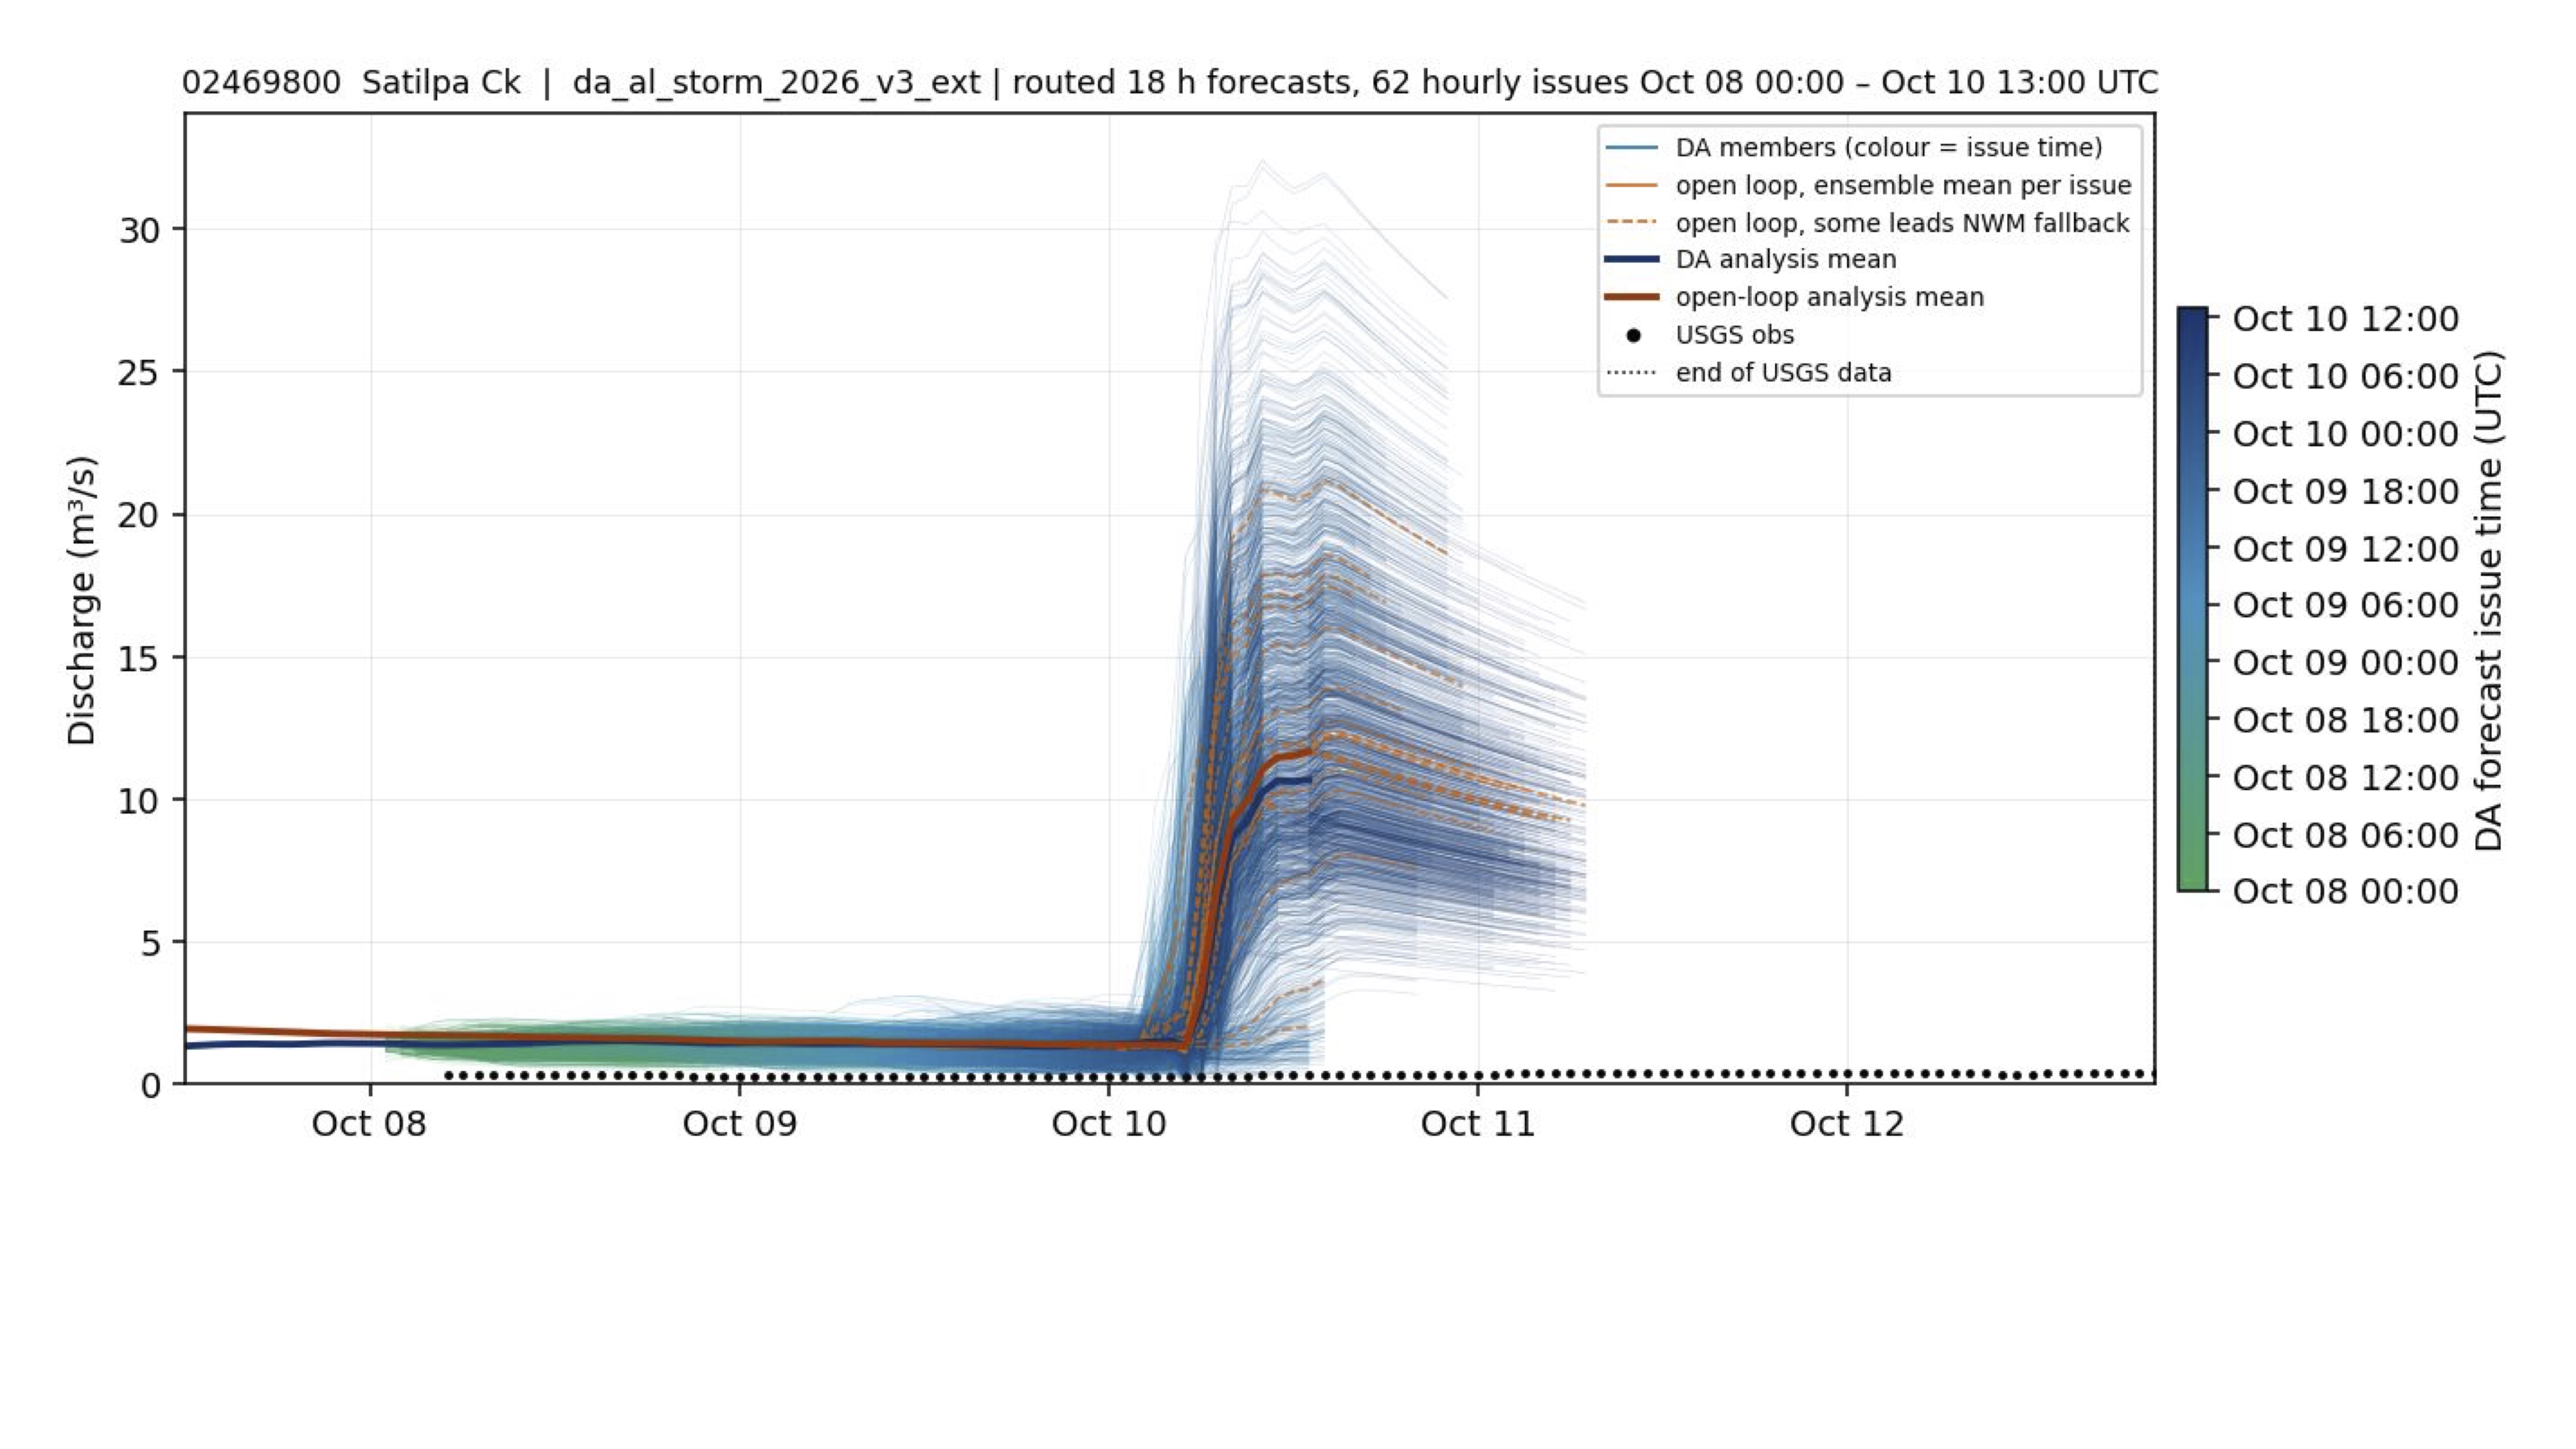
Satilpa Creek was west of the narrow heavy-rain corridor. The ensembles forecast a peak near 25 m³/s, but the gauge remained flat near zero—another clear false alarm consistent with the storm's eastward shift.
12. Paint Rock River near Woodville
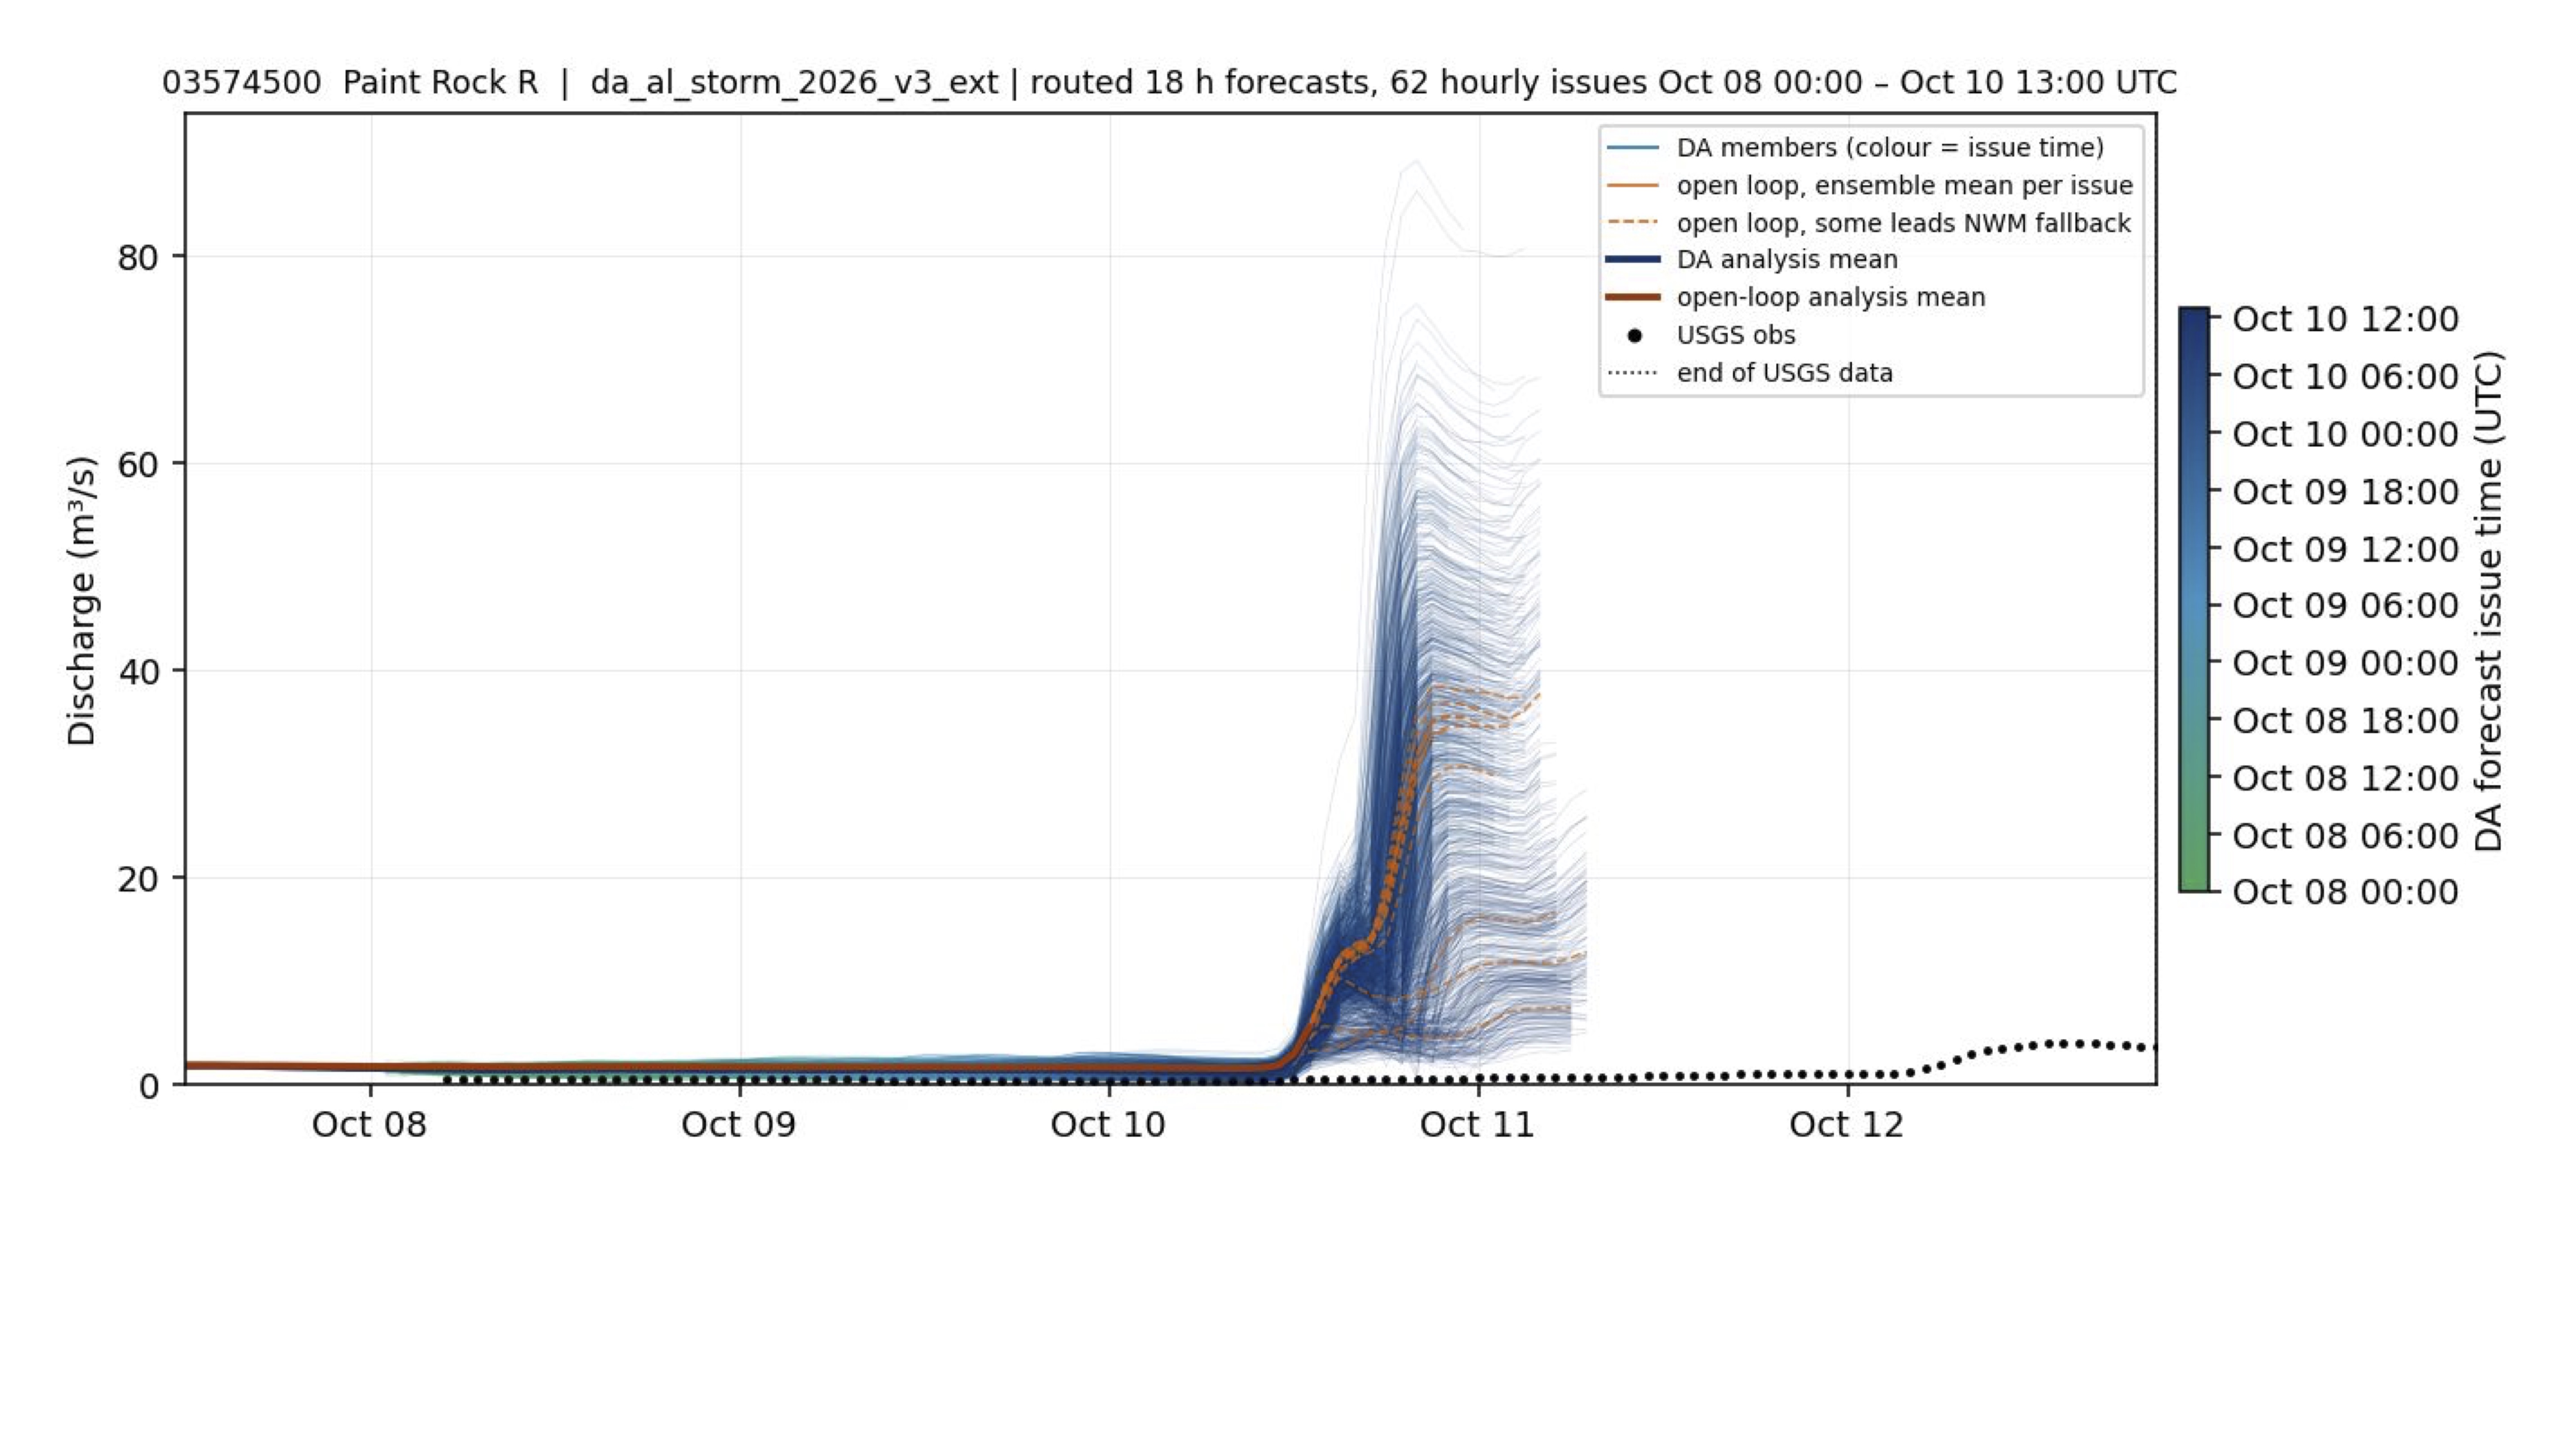
Paint Rock, in northern Alabama and far from the southeastern rainfall maximum, received little storm rainfall. Forecasts rose sharply late on October 10, with DA members spanning roughly 5-70 m³/s, while observations stayed near zero until a small rise after October 12.