Routing is a Game of Telephone
What Game are we playing?
In Hydrology there are two types of models: Lumped and Distributed. Lumped modeling involves taking an area-based measurement within a specific boundary while distributed modeling takes individual predictions and disperses flow downstream. While there are too many lumped modeling methods to keep track of, there are only few distributed modeling methods that exist. All physics-based distributed modeling methods are different solutions to the continuity (mass conservation) and momentum (timing) equations, with Muskingum-Cunge (MC) being the most commonly used. MC is a center-in-time finite difference solution to the continuity equation, assuming a prismatic flood wave as the constitutive relationship to simplify the momentum equation, and predicts the amount of downstream discharge Q(t+1) given a summation of scaled-inflows and outflows Q(t), I(t), I(t+1) where the scalar terms to each input are determined through unitless terms calculated through channel geometries, friction, and the routing timestep. Deep Learning distributed methods exist via graph-neural networks, but are not commonly used (my assumption is because they are a new to hydrology). Graph Neural Networks work well for routing since a river can be represented as the edges of a graph, with the nodes being a junction between multiple rivers. Additionally, graph neural networks utilize message passing to apply a black-box weighted function between nodes. Physical distributed models are essentially message-passing graph networks whose functions respect physical laws!
Almost all of my hydrology career, thus far, has been entangled with scaling and speeding-up MC routing methods; however, I cannot get away from the idea that the way we do physics routing is not the right answer to the ungaged streamflow problem. Yes, the application of MC works for generating a value that is reasonable when compared to local predictions, but these physical models do not have a solution for biases contained within streamflow observations. No hydrological prediction has been shown to be perfect, thus there exists some amount of error within its time-series hydrograph. When unit-catchment flow predictions are summed across a basin to route ungaged flows, the error accumulates as well as there isn't a mechanism to "forget" what has been added to the system. When these predictions are included in a routing scheme, momentum allows for better timing, but rarely are leakance/loss terms imposed.
To put this into simple terms, we're playing one giant game of telephone where the message (flow prediction) at the end of the game may/may not be correct due to a mistake along the way. The extreme case of this is shown in the below episode of Family Guy when our protagonist is asked to get a loaf of bread, a container of milk, and a stick of butter, but comes home with treasure from a fish tank and a Joe Dirt DVD.

Looking to computer science / information theory literature, the game of telephone is often referred to as temporal error accumulation, small prediction errors compounding over time as each timestep's output becomes the next timestep's input. However, this problem gets worse as for routing models there isn't one chain of information (one river), but often many rivers/tributaries flowing into the same confluence leading to spatial error accumulation. The classic game of telephone has become a telethon, where nearby river networks are playing many simultaneous telephone games, merging at every confluence, compounding errors in both space and time.
I'll say it again, there has to be a better way.
If the predictions from our model of choice can represent the catchment and it's total water mass inflows/outflows at the small scale, then we don't have to worry about routing problems. The reason I highlighted small scale is because over a large enough area, biases will still accumulate. The game of telephone can be won if there is perfect communication transfer, but given t timesteps across n nodes, biases will accumulate and cause problems.
Also no. Physical models assume that flow is un-impeded, all parameters are accurate per river per timestep (channel parameters, roughness), and cannot account for biases introduced from outside of the realm of the equations. This includes human-made interventions such as locks, dams, reservoirs, pipes, sewers, etc. that cause biases in our models. The conservation of mass becomes a conversation of bias.
How to fix the "Telethon"?
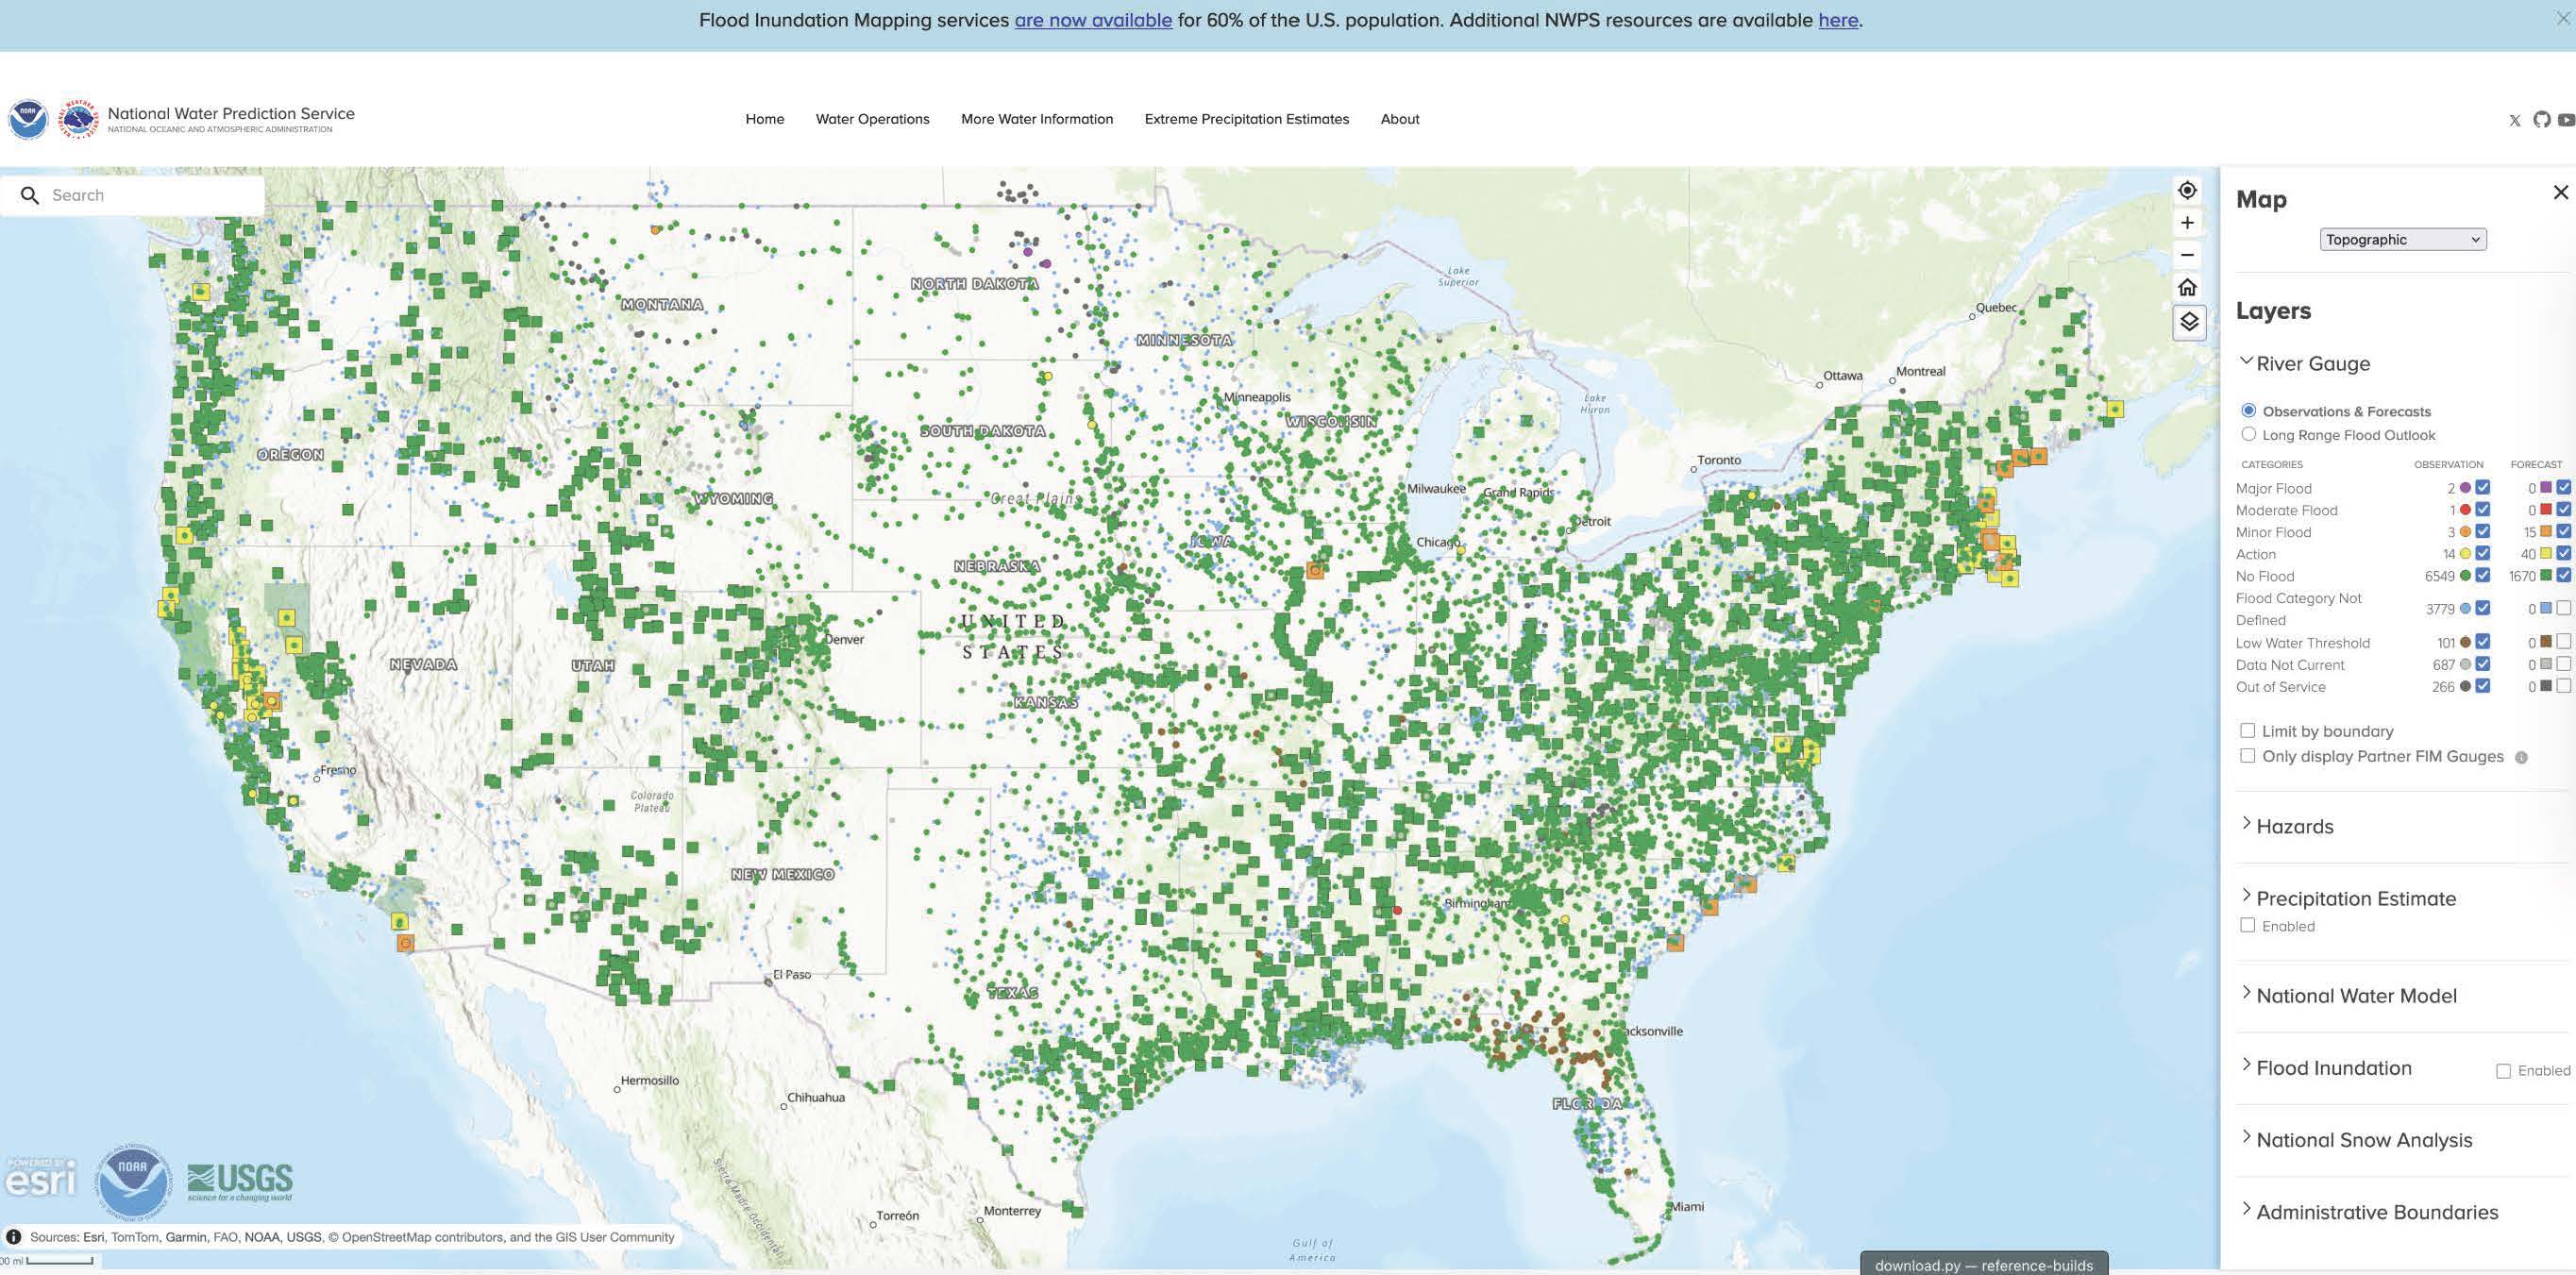
NOAA-OWP maintains a system of regional forecasting centers, and gages, across CONUS to provide observations at determined locations, displaying the results through the water.noaa.gov web portal. By using observations at key points along large river networks, total flow can be reset, detaching networks and shrinking the game of telephone into smaller pieces. Specific sections of CONUS are covered by the Replace and Route program: A methodology that ingests the official streamflow forecasts issued by the NWS RFCs at AHPS gauge locations, and utilizes the National Water Model (NWM) routing algorithm to propagate flow downstream. This method is used to delineate the River Forecast Center Flood Inundation Map (RFC FIM).
While this approach removes error, it is costly and requires in-situ infrastucture plus modelers to be monitoring the system. River systems can change, which means errors and biases may have to adjust; causing a change in the location or monitoring strategy for a part of the graph.
One can also turn to the world of machine learning / differentiable modeling for an answer. Differentiable routing models can learn river parameters to assist with timing, or calculate water loss per river reach. However, parameter learning alone doesn't solve the fundamental issue: the physics faithfully routes whatever you give it, biases and all. There needs to be an additional term to account for specific biases. NeuralOGCM offers a potential a hybrid architecture where a differentiable physics core handles large-scale dynamics while a neural corrector learns to fix what the physics gets wrong:
This blog post is a call to arms to create a better solution. What the modeling community needs is DL-based routing schemes that can learn to correct systematic biases at specific points in the spatiotemporal river graph and learn where to apply corrections. This means approaches that can learn spatial patterns of bias from regions of the river graph, adjust internal states to correct for said biases, and break connectivity / mass-conservation when appropriate. The game of telephone doesn't have to end with a Joe Dirt DVD, but can instead stay on track and advance predictions in ungaged locations.